

148
L.-L. Fu
9.2 Ocean General Circulation
A major driving goal for developing ocean altimetry mission was the vision of determining the ocean general circulation from space (Wunsch and Gaposchkin, 1980).
In parallel to the development of T/P, a satellite gravity mission was also conceived
in the early 1980s for mapping the geoid, which in combination with altimetry measurement would yield the ocean circulation. The gravity mission did not materialize
until the launch of the GRACE Mission in 2002. The accuracy of the GRACE geoid
is estimated to be 2–3 mm at scales as small as 400 km (Tapley et al., 2004). This
represents more than an order of magnitude improvement over the results based on
previous geoid models, which have errors on the order of 10 cm at scales larger than
1,000 km (Fu and Chelton, 2001).
Most of the swift boundary currents in the ocean have cross-stream scales less
than 100 km and thus are not fully resolved by using the GRACE geoid. As part
of the World Ocean Circulation Experiment conducted in the 1990s, thousands of
surface drifters were deployed in the ocean to measure surface current velocity.
Such drifters suffer from sampling errors for computing the time mean velocity. This
problem has been mitigated by combining the densely populated altimetry data with
the drifter data to correct for the sampling bias in the latter. Using this technique, the
surface mean circulation was estimated based on decade-long observations (Niiler
et al., 2003; Rio and Hernandez, 2004). Many more details of the mean circulation
have been revealed down to scales of 50–100 km. The spatial resolution is highly
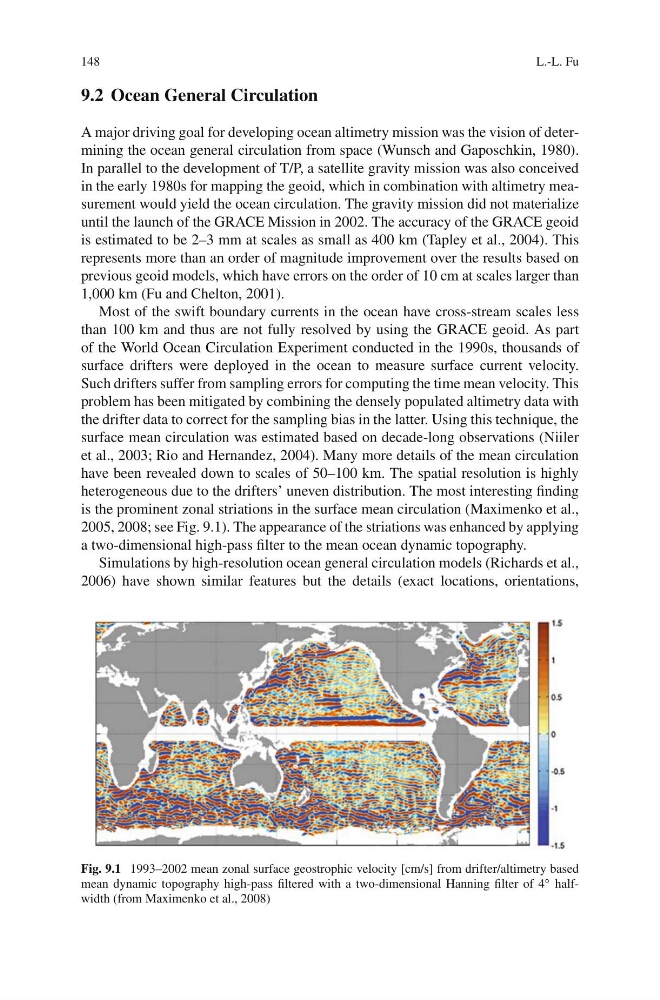
heterogeneous due to the drifters’ uneven distribution. The most interesting finding
is the prominent zonal striations in the surface mean circulation (Maximenko et al.,
2005, 2008; see Fig. 9.1). The appearance of the striations was enhanced by applying
a two-dimensional high-pass filter to the mean ocean dynamic topography.
Simulations by high-resolution ocean general circulation models (Richards et al.,
2006) have shown similar features but the details (exact locations, orientations,
Fig. 9.1 1993–2002 mean zonal surface geostrophic velocity [cm/s] from drifter/altimetry based
mean dynamic topography high-pass filtered with a two-dimensional Hanning filter of 4 ◦ halfwidth (from Maximenko et al., 2008)
L.-L. Fu
9.2 Ocean General Circulation
A major driving goal for developing ocean altimetry mission was the vision of determining the ocean general circulation from space (Wunsch and Gaposchkin, 1980).
In parallel to the development of T/P, a satellite gravity mission was also conceived
in the early 1980s for mapping the geoid, which in combination with altimetry measurement would yield the ocean circulation. The gravity mission did not materialize
until the launch of the GRACE Mission in 2002. The accuracy of the GRACE geoid
is estimated to be 2–3 mm at scales as small as 400 km (Tapley et al., 2004). This
represents more than an order of magnitude improvement over the results based on
previous geoid models, which have errors on the order of 10 cm at scales larger than
1,000 km (Fu and Chelton, 2001).
Most of the swift boundary currents in the ocean have cross-stream scales less
than 100 km and thus are not fully resolved by using the GRACE geoid. As part
of the World Ocean Circulation Experiment conducted in the 1990s, thousands of
surface drifters were deployed in the ocean to measure surface current velocity.
Such drifters suffer from sampling errors for computing the time mean velocity. This
problem has been mitigated by combining the densely populated altimetry data with
the drifter data to correct for the sampling bias in the latter. Using this technique, the
surface mean circulation was estimated based on decade-long observations (Niiler
et al., 2003; Rio and Hernandez, 2004). Many more details of the mean circulation
have been revealed down to scales of 50–100 km. The spatial resolution is highly
heterogeneous due to the drifters’ uneven distribution. The most interesting finding
is the prominent zonal striations in the surface mean circulation (Maximenko et al.,
2005, 2008; see Fig. 9.1). The appearance of the striations was enhanced by applying
a two-dimensional high-pass filter to the mean ocean dynamic topography.
Simulations by high-resolution ocean general circulation models (Richards et al.,
2006) have shown similar features but the details (exact locations, orientations,
Fig. 9.1 1993–2002 mean zonal surface geostrophic velocity [cm/s] from drifter/altimetry based
mean dynamic topography high-pass filtered with a two-dimensional Hanning filter of 4 ◦ halfwidth (from Maximenko et al., 2008)