

7 Interpretation of SAR Signatures of the Sea Surface
121
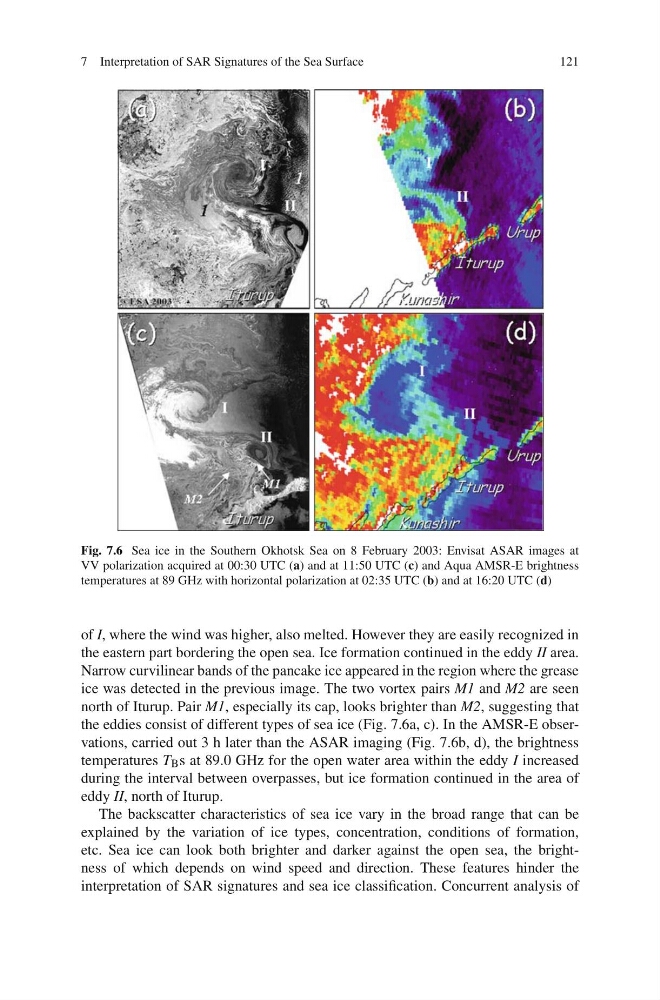
Fig. 7.6 Sea ice in the Southern Okhotsk Sea on 8 February 2003: Envisat ASAR images at
VV polarization acquired at 00:30 UTC (a) and at 11:50 UTC (c) and Aqua AMSR-E brightness
temperatures at 89 GHz with horizontal polarization at 02:35 UTC (b) and at 16:20 UTC (d)
of I, where the wind was higher, also melted. However they are easily recognized in
the eastern part bordering the open sea. Ice formation continued in the eddy II area.
Narrow curvilinear bands of the pancake ice appeared in the region where the grease
ice was detected in the previous image. The two vortex pairs M1 and M2 are seen
north of Iturup. Pair M1, especially its cap, looks brighter than M2, suggesting that
the eddies consist of different types of sea ice (Fig. 7.6a, c). In the AMSR-E observations, carried out 3 h later than the ASAR imaging (Fig. 7.6b, d), the brightness
temperatures T B s at 89.0 GHz for the open water area within the eddy I increased
during the interval between overpasses, but ice formation continued in the area of
eddy II, north of Iturup.
The backscatter characteristics of sea ice vary in the broad range that can be
explained by the variation of ice types, concentration, conditions of formation,
etc. Sea ice can look both brighter and darker against the open sea, the brightness of which depends on wind speed and direction. These features hinder the
interpretation of SAR signatures and sea ice classification. Concurrent analysis of
121
Fig. 7.6 Sea ice in the Southern Okhotsk Sea on 8 February 2003: Envisat ASAR images at
VV polarization acquired at 00:30 UTC (a) and at 11:50 UTC (c) and Aqua AMSR-E brightness
temperatures at 89 GHz with horizontal polarization at 02:35 UTC (b) and at 16:20 UTC (d)
of I, where the wind was higher, also melted. However they are easily recognized in
the eastern part bordering the open sea. Ice formation continued in the eddy II area.
Narrow curvilinear bands of the pancake ice appeared in the region where the grease
ice was detected in the previous image. The two vortex pairs M1 and M2 are seen
north of Iturup. Pair M1, especially its cap, looks brighter than M2, suggesting that
the eddies consist of different types of sea ice (Fig. 7.6a, c). In the AMSR-E observations, carried out 3 h later than the ASAR imaging (Fig. 7.6b, d), the brightness
temperatures T B s at 89.0 GHz for the open water area within the eddy I increased
during the interval between overpasses, but ice formation continued in the area of
eddy II, north of Iturup.
The backscatter characteristics of sea ice vary in the broad range that can be
explained by the variation of ice types, concentration, conditions of formation,
etc. Sea ice can look both brighter and darker against the open sea, the brightness of which depends on wind speed and direction. These features hinder the
interpretation of SAR signatures and sea ice classification. Concurrent analysis of