

7 Interpretation of SAR Signatures of the Sea Surface
119
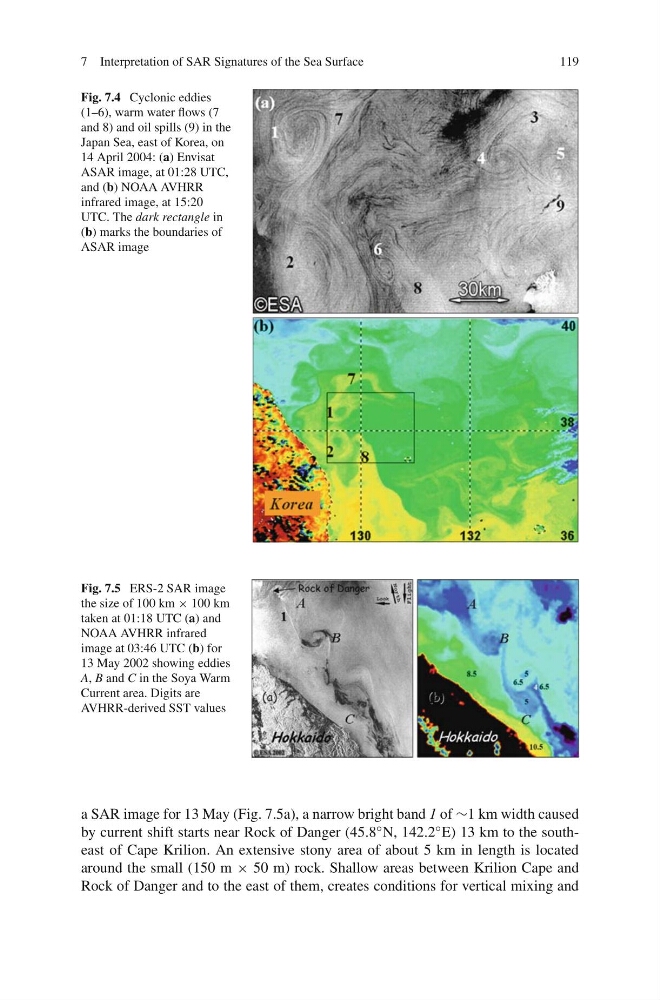
Fig. 7.4 Cyclonic eddies
(1–6), warm water flows (7
and 8) and oil spills (9) in the
Japan Sea, east of Korea, on
14 April 2004: (a) Envisat
ASAR image, at 01:28 UTC,
and (b) NOAA AVHRR
infrared image, at 15:20
UTC. The dark rectangle in
(b) marks the boundaries of
ASAR image
Fig. 7.5 ERS-2 SAR image
the size of 100 km × 100 km
taken at 01:18 UTC (a) and
NOAA AVHRR infrared
image at 03:46 UTC (b) for
13 May 2002 showing eddies
A, B and C in the Soya Warm
Current area. Digits are
AVHRR-derived SST values
a SAR image for 13 May (Fig. 7.5a), a narrow bright band 1 of ∼1 km width caused
by current shift starts near Rock of Danger (45.8 ◦ N, 142.2 ◦ E) 13 km to the southeast of Cape Krilion. An extensive stony area of about 5 km in length is located
around the small (150 m × 50 m) rock. Shallow areas between Krilion Cape and
Rock of Danger and to the east of them, creates conditions for vertical mixing and
119
Fig. 7.4 Cyclonic eddies
(1–6), warm water flows (7
and 8) and oil spills (9) in the
Japan Sea, east of Korea, on
14 April 2004: (a) Envisat
ASAR image, at 01:28 UTC,
and (b) NOAA AVHRR
infrared image, at 15:20
UTC. The dark rectangle in
(b) marks the boundaries of
ASAR image
Fig. 7.5 ERS-2 SAR image
the size of 100 km × 100 km
taken at 01:18 UTC (a) and
NOAA AVHRR infrared
image at 03:46 UTC (b) for
13 May 2002 showing eddies
A, B and C in the Soya Warm
Current area. Digits are
AVHRR-derived SST values
a SAR image for 13 May (Fig. 7.5a), a narrow bright band 1 of ∼1 km width caused
by current shift starts near Rock of Danger (45.8 ◦ N, 142.2 ◦ E) 13 km to the southeast of Cape Krilion. An extensive stony area of about 5 km in length is located
around the small (150 m × 50 m) rock. Shallow areas between Krilion Cape and
Rock of Danger and to the east of them, creates conditions for vertical mixing and