

6 Scatterometer’s Unique Capability in Measuring Ocean Surface Stress
103
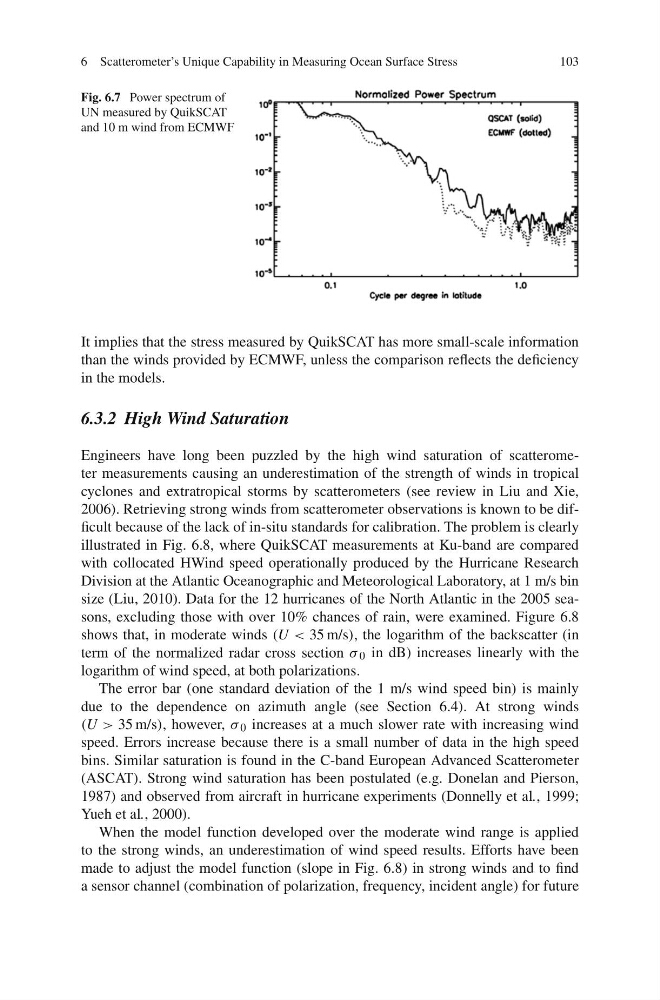
Fig. 6.7 Power spectrum of
UN measured by QuikSCAT
and 10 m wind from ECMWF
It implies that the stress measured by QuikSCAT has more small-scale information
than the winds provided by ECMWF, unless the comparison reflects the deficiency
in the models.
6.3.2 High Wind Saturation
Engineers have long been puzzled by the high wind saturation of scatterometer measurements causing an underestimation of the strength of winds in tropical
cyclones and extratropical storms by scatterometers (see review in Liu and Xie,
2006). Retrieving strong winds from scatterometer observations is known to be difficult because of the lack of in-situ standards for calibration. The problem is clearly
illustrated in Fig. 6.8, where QuikSCAT measurements at Ku-band are compared
with collocated HWind speed operationally produced by the Hurricane Research
Division at the Atlantic Oceanographic and Meteorological Laboratory, at 1 m/s bin
size (Liu, 2010). Data for the 12 hurricanes of the North Atlantic in the 2005 seasons, excluding those with over 10% chances of rain, were examined. Figure 6.8
shows that, in moderate winds (U < 35 m/s), the logarithm of the backscatter (in
term of the normalized radar cross section σ 0 in dB) increases linearly with the
logarithm of wind speed, at both polarizations.
The error bar (one standard deviation of the 1 m/s wind speed bin) is mainly
due to the dependence on azimuth angle (see Section 6.4). At strong winds
(U > 35 m/s), however, σ 0 increases at a much slower rate with increasing wind
speed. Errors increase because there is a small number of data in the high speed
bins. Similar saturation is found in the C-band European Advanced Scatterometer
(ASCAT). Strong wind saturation has been postulated (e.g. Donelan and Pierson,
1987) and observed from aircraft in hurricane experiments (Donnelly et al., 1999;
Yueh et al., 2000).
When the model function developed over the moderate wind range is applied
to the strong winds, an underestimation of wind speed results. Efforts have been
made to adjust the model function (slope in Fig. 6.8) in strong winds and to find
a sensor channel (combination of polarization, frequency, incident angle) for future
103
Fig. 6.7 Power spectrum of
UN measured by QuikSCAT
and 10 m wind from ECMWF
It implies that the stress measured by QuikSCAT has more small-scale information
than the winds provided by ECMWF, unless the comparison reflects the deficiency
in the models.
6.3.2 High Wind Saturation
Engineers have long been puzzled by the high wind saturation of scatterometer measurements causing an underestimation of the strength of winds in tropical
cyclones and extratropical storms by scatterometers (see review in Liu and Xie,
2006). Retrieving strong winds from scatterometer observations is known to be difficult because of the lack of in-situ standards for calibration. The problem is clearly
illustrated in Fig. 6.8, where QuikSCAT measurements at Ku-band are compared
with collocated HWind speed operationally produced by the Hurricane Research
Division at the Atlantic Oceanographic and Meteorological Laboratory, at 1 m/s bin
size (Liu, 2010). Data for the 12 hurricanes of the North Atlantic in the 2005 seasons, excluding those with over 10% chances of rain, were examined. Figure 6.8
shows that, in moderate winds (U < 35 m/s), the logarithm of the backscatter (in
term of the normalized radar cross section σ 0 in dB) increases linearly with the
logarithm of wind speed, at both polarizations.
The error bar (one standard deviation of the 1 m/s wind speed bin) is mainly
due to the dependence on azimuth angle (see Section 6.4). At strong winds
(U > 35 m/s), however, σ 0 increases at a much slower rate with increasing wind
speed. Errors increase because there is a small number of data in the high speed
bins. Similar saturation is found in the C-band European Advanced Scatterometer
(ASCAT). Strong wind saturation has been postulated (e.g. Donelan and Pierson,
1987) and observed from aircraft in hurricane experiments (Donnelly et al., 1999;
Yueh et al., 2000).
When the model function developed over the moderate wind range is applied
to the strong winds, an underestimation of wind speed results. Efforts have been
made to adjust the model function (slope in Fig. 6.8) in strong winds and to find
a sensor channel (combination of polarization, frequency, incident angle) for future