

o
o
o
o
90
90
o
-
o
C")
:%
C")
:%
II.>
o
C")
:%
... ..
o
0
C")
C")
:%
:%
180
180
n
:%
....
o
C")
:%
CI)
o
n
:z
'" -
o
0
o
n
:%
C")
:%
270
270
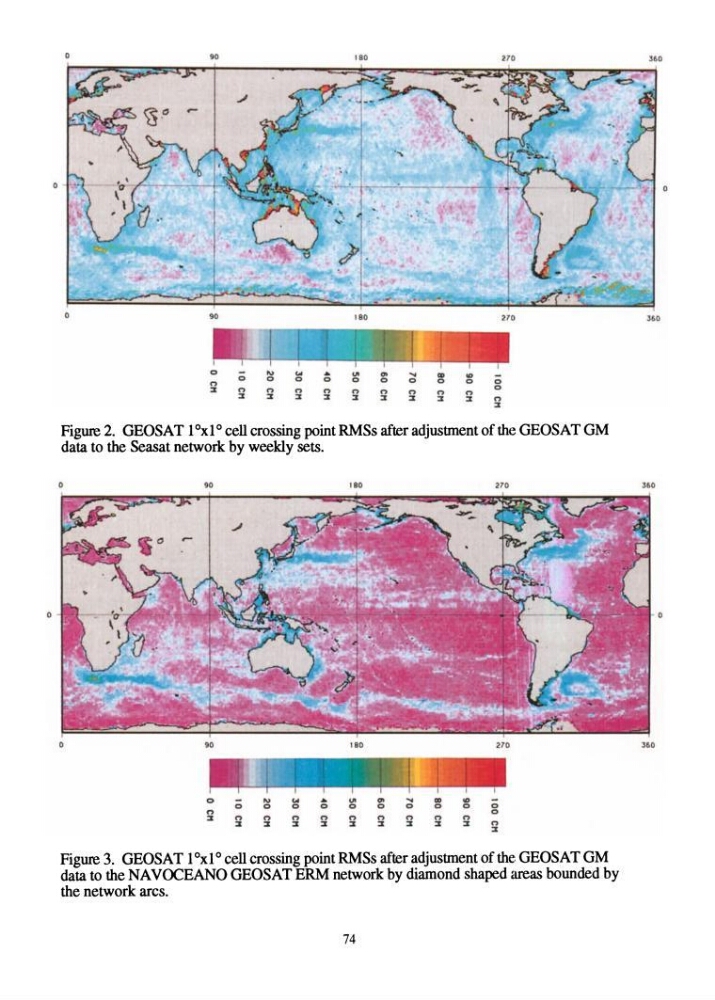
Figure 2. GEOSAT} Ox} ° cell crossing point RMSs after adjustment of the GEOSAT GM
data to the Seasat network by weekly sets.
o
o
90
180
270
90
180
270
o
-
N
W
~
~
~
~
~
~
-
o
0
0
0
0
0
0
0
0
0
(')
0
3
n
n
n
n
n
n
n
n
n
:%
:%
:%
:%
:%
:%
:%
:%
:%
(')
:%
Figure 3. GEOSAT} Ox} ° cell crossing point RMSs after adjustment of the GEOSAT GM
data to the NAVOCEANO GEOSAT ERM network by diamond shaped areas bounded by
the network arcs.
74
o
360
360
o
360
o
o
o
90
90
o
-
o
C")
:%
C")
:%
II.>
o
C")
:%
... ..
o
0
C")
C")
:%
:%
180
180
n
:%
....
o
C")
:%
CI)
o
n
:z
'" -
o
0
o
n
:%
C")
:%
270
270
Figure 2. GEOSAT} Ox} ° cell crossing point RMSs after adjustment of the GEOSAT GM
data to the Seasat network by weekly sets.
o
o
90
180
270
90
180
270
o
-
N
W
~
~
~
~
~
~
-
o
0
0
0
0
0
0
0
0
0
(')
0
3
n
n
n
n
n
n
n
n
n
:%
:%
:%
:%
:%
:%
:%
:%
:%
(')
:%
Figure 3. GEOSAT} Ox} ° cell crossing point RMSs after adjustment of the GEOSAT GM
data to the NAVOCEANO GEOSAT ERM network by diamond shaped areas bounded by
the network arcs.
74
o
360
360
o
360