

data of 34 satellites, including ERS-1 laser tracking, GPS satellite to satellite tracking and
Topex/Poseidon altimeter cross-over differences are incorporated. Over land basically the
Ohio State University October 1990, 1x1 degree data set is used (Rapp RH., Yi Y.,
1991). Additionally recently released data over CIS, South America and Greenland are
analyzed. Over the oceans, a mean sea surface based on Geosat, ERS-1 and
Topex/Poseidon altimeter data is used.
The gravity anomalies data set for the new high resolution model is composed of 3
different data sets. Where available, the Ohio State University July 1989, 3Ox30 minutes
gravity anomalies are used for the solution (Rapp RH., Kim J.H., 1990). Sufficient half
degree information is only available in Europe, North America, Australia, Japan and some
parts of Mrica. For filling the gaps, the October 1990 lxl degree data set (Rapp RH., Yi
Y., 1991) and new lxl degree mean anomalies from CIS (Makedonskii E, et al, 1994)
and South America, provided by BGI are used. Especially in CIS this: data set provides a
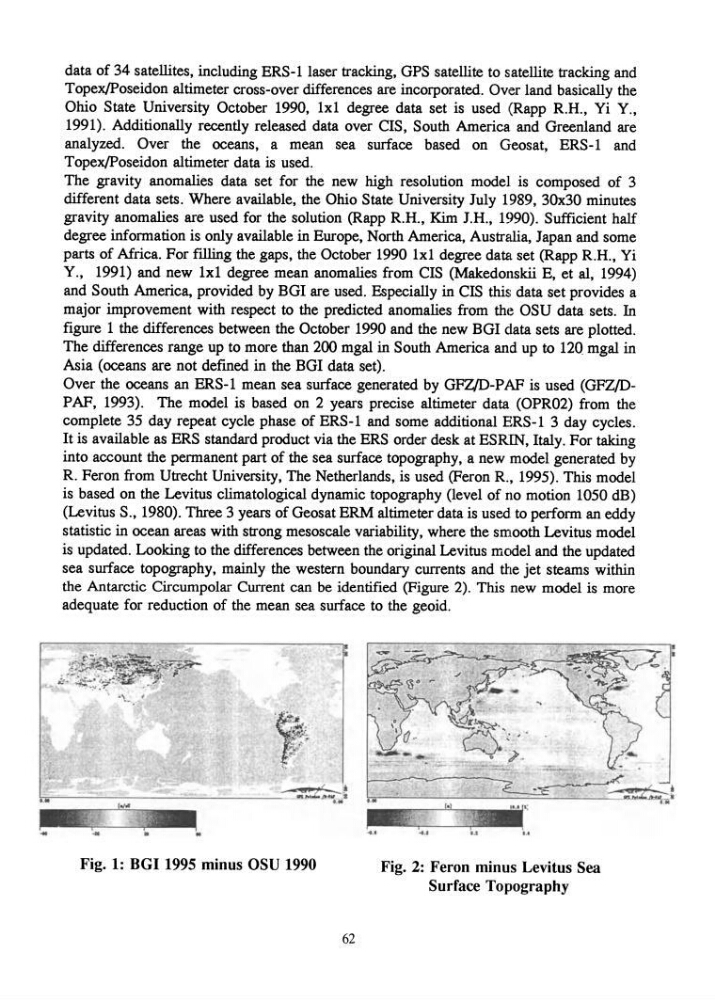
major improvement with respect to the predicted anomalies from the OSU data sets. In
figure 1 the differences between the October 1990 and the new BGI data sets are plotted.
The differences range up to more than 200 mgal in South America and up to 120 mgal in
Asia (oceans are not defmed in the BGI data set).
Over the oceans an ERS-l mean sea surface generated by GFZ/D-PAF is used (GFZ/DPAF, 1993). The model is based on 2 years precise altimeter data (OPR02) from the
complete 35 day repeat cycle phase of ERS-l and some additional ERS-1 3 day cycles.
It is available as ERS standard product via the ERS order desk at ESR[N, Italy. For taking
into account the permanent part of the sea surface topography, a new model generated by
R Feron from Utrecht University, The Netherlands, is used (Feron R, 1995). This model
is based on the Levitus climatological dynamic topography (level of no motion 1050 dB)
(Levitus S., 1980). Three 3 years of Geosat ERM altimeter data is used to perform an eddy
statistic in ocean areas with strong mesoscale variability, where the smooth Levitus model
is updated. Looking to the differences between the original Levitus model and the updated
sea surface topography, mainly the western boundary currents and the jet steams within
the Antarctic Circumpolar Current can be identified (Figure 2). This new model is more
adequate for reduction of the mean sea surface to the geoid.
Fig. 1: BGI 1995 minus OSU 1990
62
Fig. 2: Feron minus Levitus Sea
Surface Topography
Topex/Poseidon altimeter cross-over differences are incorporated. Over land basically the
Ohio State University October 1990, 1x1 degree data set is used (Rapp RH., Yi Y.,
1991). Additionally recently released data over CIS, South America and Greenland are
analyzed. Over the oceans, a mean sea surface based on Geosat, ERS-1 and
Topex/Poseidon altimeter data is used.
The gravity anomalies data set for the new high resolution model is composed of 3
different data sets. Where available, the Ohio State University July 1989, 3Ox30 minutes
gravity anomalies are used for the solution (Rapp RH., Kim J.H., 1990). Sufficient half
degree information is only available in Europe, North America, Australia, Japan and some
parts of Mrica. For filling the gaps, the October 1990 lxl degree data set (Rapp RH., Yi
Y., 1991) and new lxl degree mean anomalies from CIS (Makedonskii E, et al, 1994)
and South America, provided by BGI are used. Especially in CIS this: data set provides a
major improvement with respect to the predicted anomalies from the OSU data sets. In
figure 1 the differences between the October 1990 and the new BGI data sets are plotted.
The differences range up to more than 200 mgal in South America and up to 120 mgal in
Asia (oceans are not defmed in the BGI data set).
Over the oceans an ERS-l mean sea surface generated by GFZ/D-PAF is used (GFZ/DPAF, 1993). The model is based on 2 years precise altimeter data (OPR02) from the
complete 35 day repeat cycle phase of ERS-l and some additional ERS-1 3 day cycles.
It is available as ERS standard product via the ERS order desk at ESR[N, Italy. For taking
into account the permanent part of the sea surface topography, a new model generated by
R Feron from Utrecht University, The Netherlands, is used (Feron R, 1995). This model
is based on the Levitus climatological dynamic topography (level of no motion 1050 dB)
(Levitus S., 1980). Three 3 years of Geosat ERM altimeter data is used to perform an eddy
statistic in ocean areas with strong mesoscale variability, where the smooth Levitus model
is updated. Looking to the differences between the original Levitus model and the updated
sea surface topography, mainly the western boundary currents and the jet steams within
the Antarctic Circumpolar Current can be identified (Figure 2). This new model is more
adequate for reduction of the mean sea surface to the geoid.
Fig. 1: BGI 1995 minus OSU 1990
62
Fig. 2: Feron minus Levitus Sea
Surface Topography