

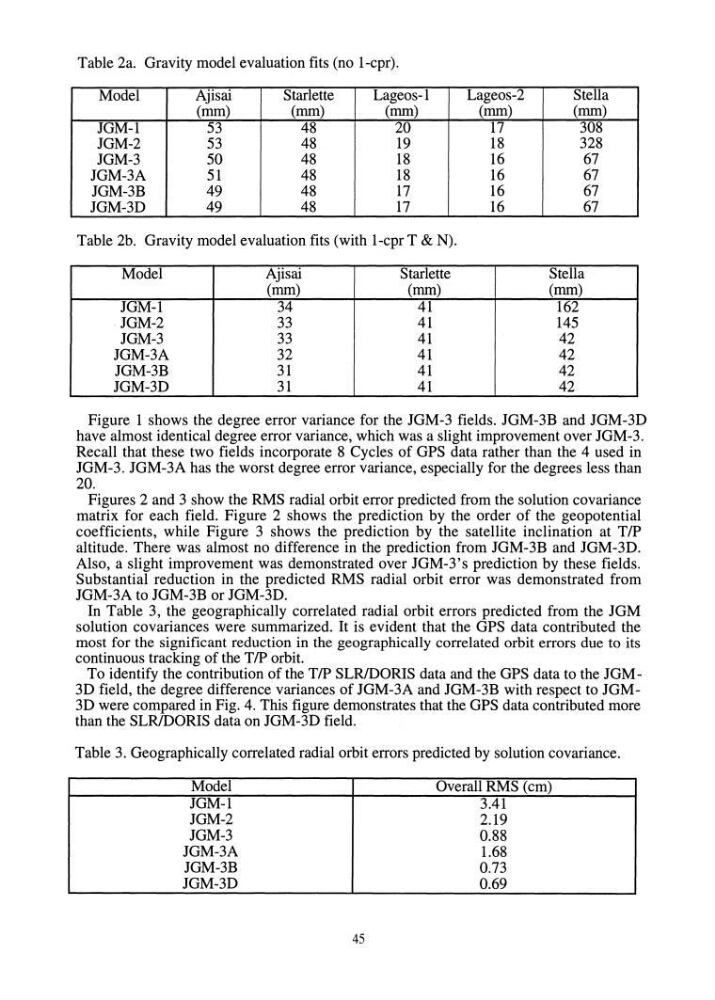
Table 2a. Gravity model evaluation fits (no I-cpr).
Model
Ajisai
Starlette
Lageos-l
Lageos-2
Stella
(mm)
(mm)
(mm)
(mm)
(mm)
JGM-l
53
48
20
17
308
JGM-2
53
48
19
18
328
JGM-3
50
48
18
16
67
JGM-3A
51
48
18
16
67
JGM-3B
49
48
17
16
67
JGM-3D
49
48
17
16
67
Table 2b. Gravity model evaluation fits (with I-cpr T & N).
Model
Ajisai
Starlette
Stella
(mm)
(mm)
(mm)
JGM-l
34
41
162
. JGM-2
33
41
145
JGM-3
33
41
42
JGM-3A
32
41
42
JGM-3B
31
41
42
JGM-3D
31
41
42
Figure 1 shows the degree error variance for the JGM-3 fields. JGM-3B and JGM-3D
have almost identical degree error variance, which was a slight improvement over JGM-3.
Recall that these two fields incorporate 8 Cycles of GPS data rather than the 4 used in
JGM-3. JGM-3A has the worst degree error variance, especially for the degrees less than
20.
Figures 2 and 3 show the RMS radial orbit error predicted from the solution covariance
matrix for each field. Figure 2 shows the prediction by the order of the geopotential
coefficients, while Figure 3 shows the prediction by the satellite inclination at TIP
altitude. There was almost no difference in the prediction from JGM-3B and JGM-3D.
Also, a slight improvement was demonstrated over JGM-3's prediction by these fields.
Substantial reduction in the predicted RMS radial orbit error was demonstrated from
JGM-3A to JGM-3B or JGM-3D.
In Table 3, the geographically correlated radial orbit errors predicted from the JGM
solution covariances were summarized. It is evident that the GPS data contributed the
most for the significant reduction in the geographically correlated orbit errors due to its
continuous tracking of the TIP orbit.
To identify the contribution of the TIP SLRlDORIS data and the GPS data to the JGM3D field, the degree difference variances of JGM-3A and JGM-3B with respect to JGM3D were compared in Fig. 4. This figure demonstrates that the GPS data contributed more
than the SLRlDORIS data on JGM-3D field.
Table 3. Geographically correlated radial orbit errors predicted by solution covariance.
Model
Overall RMS (cm)
JGM-l
3.41
JGM-2
2.19
JGM-3
0.88
JGM-3A
1.68
JGM-3B
0.73
JGM-3D
0.69
45
Model
Ajisai
Starlette
Lageos-l
Lageos-2
Stella
(mm)
(mm)
(mm)
(mm)
(mm)
JGM-l
53
48
20
17
308
JGM-2
53
48
19
18
328
JGM-3
50
48
18
16
67
JGM-3A
51
48
18
16
67
JGM-3B
49
48
17
16
67
JGM-3D
49
48
17
16
67
Table 2b. Gravity model evaluation fits (with I-cpr T & N).
Model
Ajisai
Starlette
Stella
(mm)
(mm)
(mm)
JGM-l
34
41
162
. JGM-2
33
41
145
JGM-3
33
41
42
JGM-3A
32
41
42
JGM-3B
31
41
42
JGM-3D
31
41
42
Figure 1 shows the degree error variance for the JGM-3 fields. JGM-3B and JGM-3D
have almost identical degree error variance, which was a slight improvement over JGM-3.
Recall that these two fields incorporate 8 Cycles of GPS data rather than the 4 used in
JGM-3. JGM-3A has the worst degree error variance, especially for the degrees less than
20.
Figures 2 and 3 show the RMS radial orbit error predicted from the solution covariance
matrix for each field. Figure 2 shows the prediction by the order of the geopotential
coefficients, while Figure 3 shows the prediction by the satellite inclination at TIP
altitude. There was almost no difference in the prediction from JGM-3B and JGM-3D.
Also, a slight improvement was demonstrated over JGM-3's prediction by these fields.
Substantial reduction in the predicted RMS radial orbit error was demonstrated from
JGM-3A to JGM-3B or JGM-3D.
In Table 3, the geographically correlated radial orbit errors predicted from the JGM
solution covariances were summarized. It is evident that the GPS data contributed the
most for the significant reduction in the geographically correlated orbit errors due to its
continuous tracking of the TIP orbit.
To identify the contribution of the TIP SLRlDORIS data and the GPS data to the JGM3D field, the degree difference variances of JGM-3A and JGM-3B with respect to JGM3D were compared in Fig. 4. This figure demonstrates that the GPS data contributed more
than the SLRlDORIS data on JGM-3D field.
Table 3. Geographically correlated radial orbit errors predicted by solution covariance.
Model
Overall RMS (cm)
JGM-l
3.41
JGM-2
2.19
JGM-3
0.88
JGM-3A
1.68
JGM-3B
0.73
JGM-3D
0.69
45