

Two years of Topex-Poseidon altimeter data have been analysed for this purpose, from
December 1992 through December 1994. The Topex-Poseidon altimeter data have been
corrected for solid and ocean tides, ocean tide loading, dry and wet tropospheric delay,
ionospheric delay and variable sea state. Since the Topex-Poseidon satellite is on a
10-day repeat orbit, altimeter data of each 10-day cycle have been expressed relatively to
yearly averaged data at each subsatellite measurement point, allowing us to extract the
time variable sea surface height signal. For each 10-day cycle we have computed the
variable ocean surface load, hence according to Eq.l, the corresponding ocean effect on
J 2 . The variable sea surface height computed from Topex-Poseidon results from two
effects : steric and mass transport effects. Steric effects are due to thermal expansion or
contraction of the oceans and do not change the inertia tensor, hence J 2 . To estimate the
steric effect, we used the Levitus climatology (1994) which gives monthly fields of
temperature and salinity at different ocean depths over the world oceans. These data have
allowed us to compute the annual steric sea surface height. Difference between the
Topex-Poseidon-derived sea surface height and Levitus-derived steric height provides an
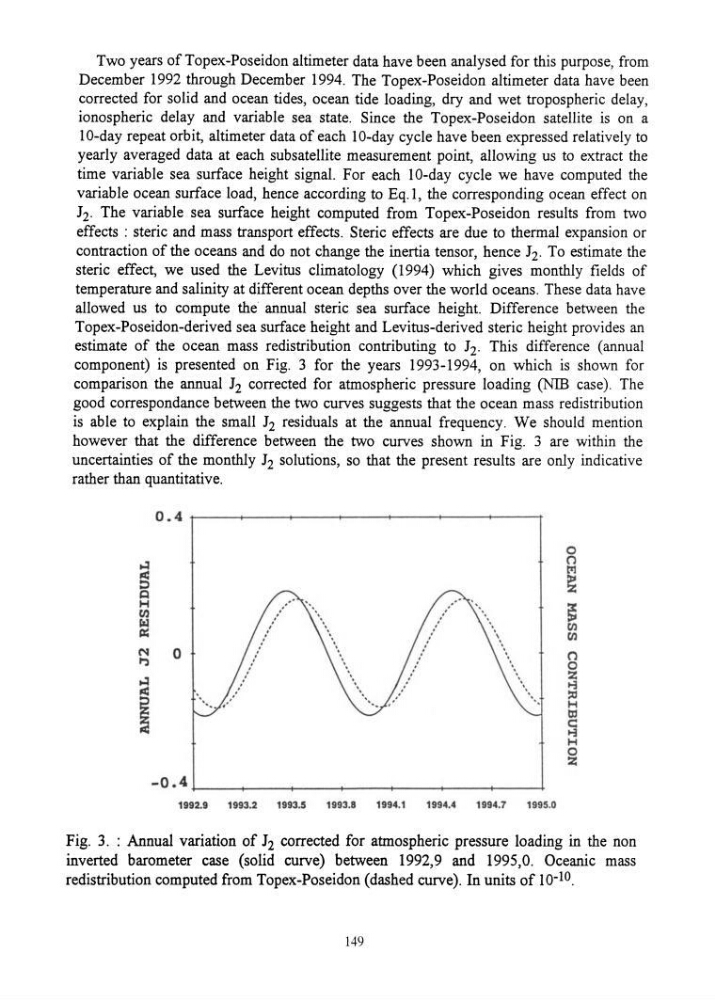
estimate of the ocean mass redistribution contributing to J 2 . This difference (annual
component) is presented on Fig. 3 for the years 1993-1994, on which is shown for
comparison the annual J 2 corrected for atmospheric pressure loading (NIB case). The
good correspondance between the two curves suggests that the ocean mass redistribution
is able to explain the small J 2 residuals at the annual frequency. We should mention
however that the difference between the two curves shown in Fig. 3 are within the
uncertainties of the monthly J 2 solutions, so that the present results are only indicative
rather than quantitative.
0.4
0
~
n
rrt
:3
~
~
H
, "
~
en
, ,
fal
, ,
en
c:
,
en
"
N
0
,
,
n
I')
,
0
,
Z
~
,
t-3
~
=
~
.
H
a:I
c::
t-3
H
0
z
-0.4
1992.9
1993.2
1993.5
1993.8
1994.1
1994.4
1994.7
1995.0
Fig. 3. : Annual variation of J 2 corrected for atmospheric pressure loading in the non
inverted barometer case (solid curve) between 1992,9 and 1995,0. Oceanic mass
redistribution computed from Topex-Poseidon (dashed curve). In units of 10- 10 .
149
December 1992 through December 1994. The Topex-Poseidon altimeter data have been
corrected for solid and ocean tides, ocean tide loading, dry and wet tropospheric delay,
ionospheric delay and variable sea state. Since the Topex-Poseidon satellite is on a
10-day repeat orbit, altimeter data of each 10-day cycle have been expressed relatively to
yearly averaged data at each subsatellite measurement point, allowing us to extract the
time variable sea surface height signal. For each 10-day cycle we have computed the
variable ocean surface load, hence according to Eq.l, the corresponding ocean effect on
J 2 . The variable sea surface height computed from Topex-Poseidon results from two
effects : steric and mass transport effects. Steric effects are due to thermal expansion or
contraction of the oceans and do not change the inertia tensor, hence J 2 . To estimate the
steric effect, we used the Levitus climatology (1994) which gives monthly fields of
temperature and salinity at different ocean depths over the world oceans. These data have
allowed us to compute the annual steric sea surface height. Difference between the
Topex-Poseidon-derived sea surface height and Levitus-derived steric height provides an
estimate of the ocean mass redistribution contributing to J 2 . This difference (annual
component) is presented on Fig. 3 for the years 1993-1994, on which is shown for
comparison the annual J 2 corrected for atmospheric pressure loading (NIB case). The
good correspondance between the two curves suggests that the ocean mass redistribution
is able to explain the small J 2 residuals at the annual frequency. We should mention
however that the difference between the two curves shown in Fig. 3 are within the
uncertainties of the monthly J 2 solutions, so that the present results are only indicative
rather than quantitative.
0.4
0
~
n
rrt
:3
~
~
H
, "
~
en
, ,
fal
, ,
en
c:
,
en
"
N
0
,
,
n
I')
,
0
,
Z
~
,
t-3
~
=
~
.
H
a:I
c::
t-3
H
0
z
-0.4
1992.9
1993.2
1993.5
1993.8
1994.1
1994.4
1994.7
1995.0
Fig. 3. : Annual variation of J 2 corrected for atmospheric pressure loading in the non
inverted barometer case (solid curve) between 1992,9 and 1995,0. Oceanic mass
redistribution computed from Topex-Poseidon (dashed curve). In units of 10- 10 .
149