

14.5 Differential Rates of Population Decline
235
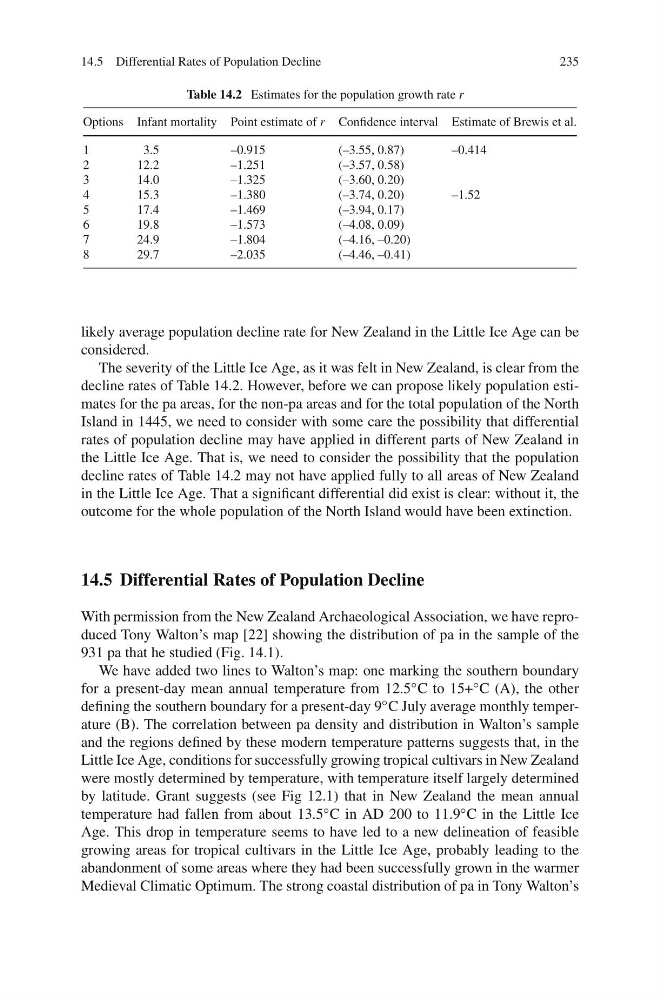
Table 14.2 Estimates for the population growth rate r
Options Infant mortality Point estimate of r Confidence interval Estimate of Brewis et al.
1
3.5
–0.915
(–3.55, 0.87)
–0.414
2
12.2
–1.251
(–3.57, 0.58)
3
14.0
–1.325
(–3.60, 0.20)
4
15.3
–1.380
(–3.74, 0.20)
–1.52
5
17.4
–1.469
(–3.94, 0.17)
6
19.8
–1.573
(–4.08, 0.09)
7
24.9
–1.804
(–4.16, –0.20)
8
29.7
–2.035
(–4.46, –0.41)
likely average population decline rate for New Zealand in the Little Ice Age can be
considered.
The severity of the Little Ice Age, as it was felt in New Zealand, is clear from the
decline rates of Table 14.2. However, before we can propose likely population estimates for the pa areas, for the non-pa areas and for the total population of the North
Island in 1445, we need to consider with some care the possibility that differential
rates of population decline may have applied in different parts of New Zealand in
the Little Ice Age. That is, we need to consider the possibility that the population
decline rates of Table 14.2 may not have applied fully to all areas of New Zealand
in the Little Ice Age. That a significant differential did exist is clear: without it, the
outcome for the whole population of the North Island would have been extinction.
14.5 Differential Rates of Population Decline
With permission from the New Zealand Archaeological Association, we have reproduced Tony Walton’s map [22] showing the distribution of pa in the sample of the
931 pa that he studied (Fig. 14.1).
We have added two lines to Walton’s map: one marking the southern boundary
for a present-day mean annual temperature from 12.5 ◦ C to 15+ ◦ C (A), the other
defining the southern boundary for a present-day 9 ◦ C July average monthly temperature (B). The correlation between pa density and distribution in Walton’s sample
and the regions defined by these modern temperature patterns suggests that, in the
Little Ice Age, conditions for successfully growing tropical cultivars in New Zealand
were mostly determined by temperature, with temperature itself largely determined
by latitude. Grant suggests (see Fig 12.1) that in New Zealand the mean annual
temperature had fallen from about 13.5 ◦ C in AD 200 to 11.9 ◦ C in the Little Ice
Age. This drop in temperature seems to have led to a new delineation of feasible
growing areas for tropical cultivars in the Little Ice Age, probably leading to the
abandonment of some areas where they had been successfully grown in the warmer
Medieval Climatic Optimum. The strong coastal distribution of pa in Tony Walton’s
235
Table 14.2 Estimates for the population growth rate r
Options Infant mortality Point estimate of r Confidence interval Estimate of Brewis et al.
1
3.5
–0.915
(–3.55, 0.87)
–0.414
2
12.2
–1.251
(–3.57, 0.58)
3
14.0
–1.325
(–3.60, 0.20)
4
15.3
–1.380
(–3.74, 0.20)
–1.52
5
17.4
–1.469
(–3.94, 0.17)
6
19.8
–1.573
(–4.08, 0.09)
7
24.9
–1.804
(–4.16, –0.20)
8
29.7
–2.035
(–4.46, –0.41)
likely average population decline rate for New Zealand in the Little Ice Age can be
considered.
The severity of the Little Ice Age, as it was felt in New Zealand, is clear from the
decline rates of Table 14.2. However, before we can propose likely population estimates for the pa areas, for the non-pa areas and for the total population of the North
Island in 1445, we need to consider with some care the possibility that differential
rates of population decline may have applied in different parts of New Zealand in
the Little Ice Age. That is, we need to consider the possibility that the population
decline rates of Table 14.2 may not have applied fully to all areas of New Zealand
in the Little Ice Age. That a significant differential did exist is clear: without it, the
outcome for the whole population of the North Island would have been extinction.
14.5 Differential Rates of Population Decline
With permission from the New Zealand Archaeological Association, we have reproduced Tony Walton’s map [22] showing the distribution of pa in the sample of the
931 pa that he studied (Fig. 14.1).
We have added two lines to Walton’s map: one marking the southern boundary
for a present-day mean annual temperature from 12.5 ◦ C to 15+ ◦ C (A), the other
defining the southern boundary for a present-day 9 ◦ C July average monthly temperature (B). The correlation between pa density and distribution in Walton’s sample
and the regions defined by these modern temperature patterns suggests that, in the
Little Ice Age, conditions for successfully growing tropical cultivars in New Zealand
were mostly determined by temperature, with temperature itself largely determined
by latitude. Grant suggests (see Fig 12.1) that in New Zealand the mean annual
temperature had fallen from about 13.5 ◦ C in AD 200 to 11.9 ◦ C in the Little Ice
Age. This drop in temperature seems to have led to a new delineation of feasible
growing areas for tropical cultivars in the Little Ice Age, probably leading to the
abandonment of some areas where they had been successfully grown in the warmer
Medieval Climatic Optimum. The strong coastal distribution of pa in Tony Walton’s