

14.4 Refined Estimation
233
had an infant mortality rate of about 10%. At the other extreme Maori infant mortality following the advent of infectious diseases with European colonization has been
estimated to have been 36.5–41.9% (Pool [14]), which it is claimed may suggest
a maximum infant mortality of about 30% in prehistoric New Zealand (see Brewis
[19]).
A recent study by Navara [20] and the references therein support the choice q=
0.488 in assumption (iii) as being accurate.
Assumption (iv) is biologically unrealistic and was made for simplicity of calculation. In view of the highly non-linear way in which population growth rate depends
on age-specific fertility we can expect this assumption to introduce bias.
We now turn to assumption (v). Phillipps states that Maori women gave birth at
a fairly uniform rate from age 20 to age 34 (and then reached menopause), with an
average of 3.4 children when they lived that period out fully. See also Sutton [5]
for a discussion of her results. Her conclusion derives from estimates of the number
of children produced by each of a sample of 33 women (estimated from two sites
of pelvic pitting), coupled with corresponding estimates for age at death. The two
pelvic counts were close in all but one of the skeletons (which we have set aside).
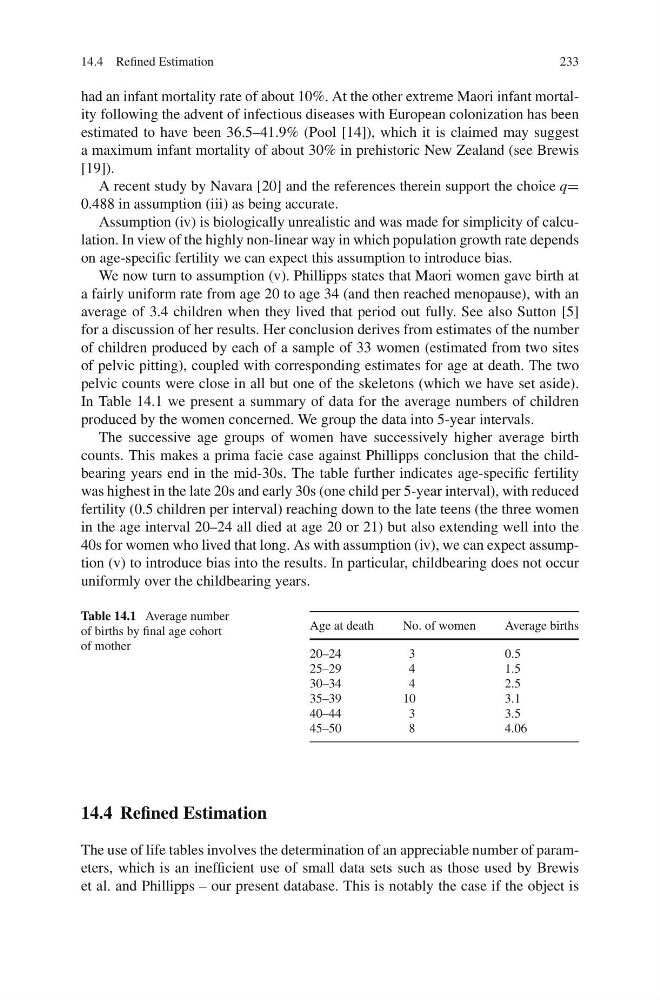
In Table 14.1 we present a summary of data for the average numbers of children
produced by the women concerned. We group the data into 5-year intervals.
The successive age groups of women have successively higher average birth
counts. This makes a prima facie case against Phillipps conclusion that the childbearing years end in the mid-30s. The table further indicates age-specific fertility
was highest in the late 20s and early 30s (one child per 5-year interval), with reduced
fertility (0.5 children per interval) reaching down to the late teens (the three women
in the age interval 20–24 all died at age 20 or 21) but also extending well into the
40s for women who lived that long. As with assumption (iv), we can expect assumption (v) to introduce bias into the results. In particular, childbearing does not occur
uniformly over the childbearing years.
Table 14.1 Average number
of births by final age cohort
of mother
Age at death
No. of women
Average births
20–24
3
0.5
25–29
4
1.5
30–34
4
2.5
35–39
10
3.1
40–44
3
3.5
45–50
8
4.06
14.4 Refined Estimation
The use of life tables involves the determination of an appreciable number of parameters, which is an inefficient use of small data sets such as those used by Brewis
et al. and Phillipps – our present database. This is notably the case if the object is
233
had an infant mortality rate of about 10%. At the other extreme Maori infant mortality following the advent of infectious diseases with European colonization has been
estimated to have been 36.5–41.9% (Pool [14]), which it is claimed may suggest
a maximum infant mortality of about 30% in prehistoric New Zealand (see Brewis
[19]).
A recent study by Navara [20] and the references therein support the choice q=
0.488 in assumption (iii) as being accurate.
Assumption (iv) is biologically unrealistic and was made for simplicity of calculation. In view of the highly non-linear way in which population growth rate depends
on age-specific fertility we can expect this assumption to introduce bias.
We now turn to assumption (v). Phillipps states that Maori women gave birth at
a fairly uniform rate from age 20 to age 34 (and then reached menopause), with an
average of 3.4 children when they lived that period out fully. See also Sutton [5]
for a discussion of her results. Her conclusion derives from estimates of the number
of children produced by each of a sample of 33 women (estimated from two sites
of pelvic pitting), coupled with corresponding estimates for age at death. The two
pelvic counts were close in all but one of the skeletons (which we have set aside).
In Table 14.1 we present a summary of data for the average numbers of children
produced by the women concerned. We group the data into 5-year intervals.
The successive age groups of women have successively higher average birth
counts. This makes a prima facie case against Phillipps conclusion that the childbearing years end in the mid-30s. The table further indicates age-specific fertility
was highest in the late 20s and early 30s (one child per 5-year interval), with reduced
fertility (0.5 children per interval) reaching down to the late teens (the three women
in the age interval 20–24 all died at age 20 or 21) but also extending well into the
40s for women who lived that long. As with assumption (iv), we can expect assumption (v) to introduce bias into the results. In particular, childbearing does not occur
uniformly over the childbearing years.
Table 14.1 Average number
of births by final age cohort
of mother
Age at death
No. of women
Average births
20–24
3
0.5
25–29
4
1.5
30–34
4
2.5
35–39
10
3.1
40–44
3
3.5
45–50
8
4.06
14.4 Refined Estimation
The use of life tables involves the determination of an appreciable number of parameters, which is an inefficient use of small data sets such as those used by Brewis
et al. and Phillipps – our present database. This is notably the case if the object is