

Stein et at.,' Late Ouaternary Organic Carbon and Biomarker Records (rom the Laptev Sea
A
2,01--+-+---+-+-----j-7fi~If--+---1
l 1.5
j
l! 1.01--+-- 1----Jt'"""I--::04------::l-+"7"'F----1
~
g
j 0,5
B
l
j
l!
~
~
0
~
C
l
j
l!
~
g
'ii
~
0.0"",,,,'--"'--I--4--+--1---I--';'--!---1
0.00 0.02 0.04 0.06 0,06 0.10 0.12 0," 0,16 0,18
TOIaJ Nhrogon (%)
2.5
pJ 2474
2,0
1,5
1,0
0,5
.
/ '
. ~~ ~ v.
. ~~ .
,. .
. ~
~ . .
. ...&0
,/' -
V
, I' o . ' ~"", j .... ,.) .... . ).".
0,0
0.00 0,02 0,04 0.06 0.06 0.10 0,12 0.14 0,16 0,18
TOC", N'lrogotl (%0)
2,5
PS 476
2.0
1,5
1,0
V
./'
.~
~
~
~.
~
0,5
V
.
V
. ·" t' . j,oo"'1 R"2 i ·· ...
0.0
0,00 0,02 0,04 0,06 0,06 0.10 0.12 0," 0,16 0.18
TOCa' NKrogon (%0)
649
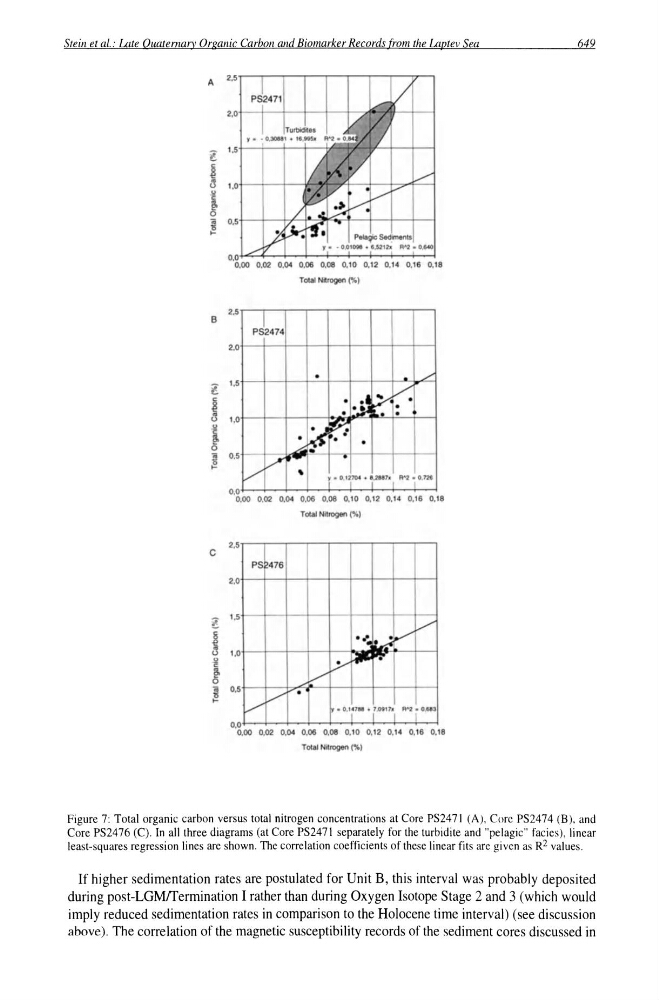
Figure 7: Total organic carbon versus total nitrogen concentrations at Core PS2471 (A), Core PS2474 (B), and
Core PS2476 (e). In all three diagrams (at Core PS2471 separately for the turbidite and "pelagic" facies), linear
least-squares regression lines are shown. The correlation coefficients of these linear fits are given as R2 values.
If higher sedimentation rates are postulated for Unit B, this interval was probably deposited
during post-LGMrrermination I rather than during Oxygen Isotope Stage 2 and 3 (which would
imply reduced sedimentation rates in comparison to the Holocene time interval) (see discussion
above). The correlation of the magnetic susceptibility records of the sediment cores discussed in
A
2,01--+-+---+-+-----j-7fi~If--+---1
l 1.5
j
l! 1.01--+-- 1----Jt'"""I--::04------::l-+"7"'F----1
~
g
j 0,5
B
l
j
l!
~
~
0
~
C
l
j
l!
~
g
'ii
~
0.0"",,,,'--"'--I--4--+--1---I--';'--!---1
0.00 0.02 0.04 0.06 0,06 0.10 0.12 0," 0,16 0,18
TOIaJ Nhrogon (%)
2.5
pJ 2474
2,0
1,5
1,0
0,5
.
/ '
. ~~ ~ v.
. ~~ .
,. .
. ~
~ . .
. ...&0
,/' -
V
, I' o . ' ~"", j .... ,.) .... . ).".
0,0
0.00 0,02 0,04 0.06 0.06 0.10 0,12 0.14 0,16 0,18
TOC", N'lrogotl (%0)
2,5
PS 476
2.0
1,5
1,0
V
./'
.~
~
~
~.
~
0,5
V
.
V
. ·" t' . j,oo"'1 R"2 i ·· ...
0.0
0,00 0,02 0,04 0,06 0,06 0.10 0.12 0," 0,16 0.18
TOCa' NKrogon (%0)
649
Figure 7: Total organic carbon versus total nitrogen concentrations at Core PS2471 (A), Core PS2474 (B), and
Core PS2476 (e). In all three diagrams (at Core PS2471 separately for the turbidite and "pelagic" facies), linear
least-squares regression lines are shown. The correlation coefficients of these linear fits are given as R2 values.
If higher sedimentation rates are postulated for Unit B, this interval was probably deposited
during post-LGMrrermination I rather than during Oxygen Isotope Stage 2 and 3 (which would
imply reduced sedimentation rates in comparison to the Holocene time interval) (see discussion
above). The correlation of the magnetic susceptibility records of the sediment cores discussed in