

524
Land-Ocean Systems in the Siberian Arctic: Dynamics and History
the sediment even at those localities with lower accumulation rates. Further the comparison of
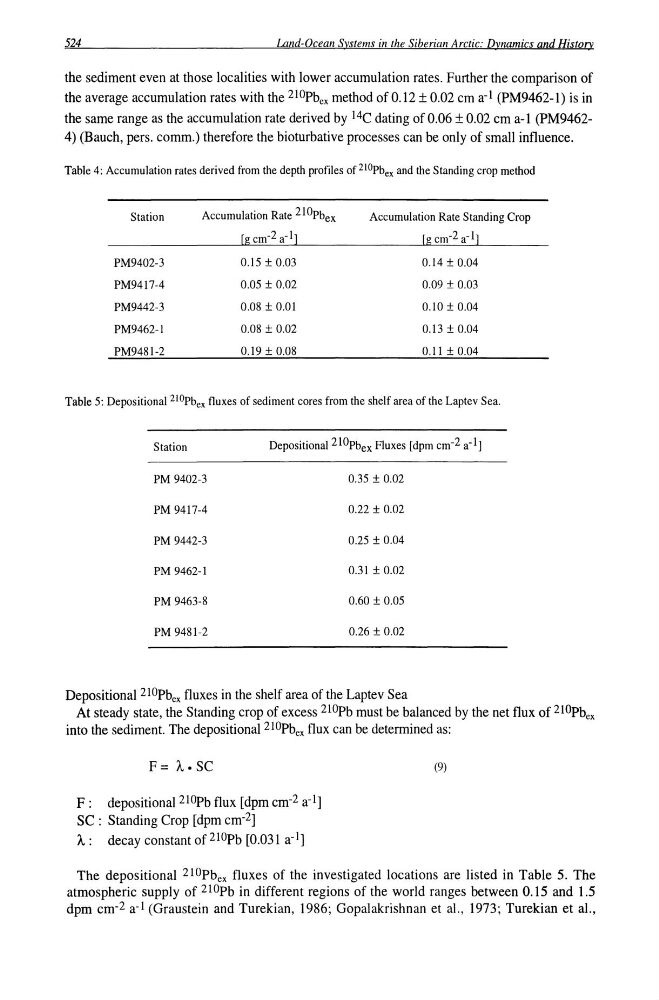
the average accumulation rates with the 210Pbex method of 0.12 ± 0.02 em a-I (PM9462-l) is in
the same range as the accumulation rate derived by 14C dating of 0.06 ± 0.02 em a-I (PM94624) (Bauch, pers. comm.) therefore the bioturbative processes can be only of small influence.
Table 4: Accumulation rates derived from the depth profiles of 2IOPbex and the Standing crop method
Station
Accumulation Rate 21 0pb ex
Accumulation Rate Standing Crop
[g cm-2 a-I]
[g cm-2 a-I]
PM9402-3
0.15 ± 0.03
0.14 ± 0.04
PM9417-4
0.05 ± 0.02
0.09 ± 0.03
PM9442-3
0.08 ± 0.01
0.10 ± 0.04
PM9462-1
0.08 ± 0.02
0.13 ± 0.04
PM9481-2
0.19 ± 0.08
0.11 ± 0.04
Table 5: Depositional 2 10pbex fluxes of sediment cores from the shelf area of the Laptev Sea.
Station
Depositional 210pb ex Fluxes [dpm cm-2 a-I]
PM 9402-3
0.35 ± 0.02
PM 9417-4
0.22 ± 0.02
PM 9442-3
0.25 ± 0.04
PM 9462-1
0.31 ± 0.02
PM 9463-8
0.60 ± 0.05
PM 9481-2
0.26 ± 0.02
Depositional 210Pb ex fluxes in the shelf area of the Laptev Sea
At steady state, the Standing crop of excess 210Pb must be balanced by the net flux of 210Pb ex
into the sediment. The depositional 210Pbex flux can be determined as:
F = 'A. SC
F: depositional 210Pb flux [dpm cm- 2 a-I]
SC: Standing Crop [dpm cm- 2 ]
'A: decay constant of 210Pb [0.031 a-I]
(9)
The depositional 210Pbex fluxes of the investigated locations are listed in Table 5. The
atmospheric supply of 210Pb in different regions of the world ranges between 0.15 and 1.5
dpm cm-2 a-I (Graustein and Turekian, 1986; GopaJakrishnan et a!., 1973; Turekian et aI.,
Land-Ocean Systems in the Siberian Arctic: Dynamics and History
the sediment even at those localities with lower accumulation rates. Further the comparison of
the average accumulation rates with the 210Pbex method of 0.12 ± 0.02 em a-I (PM9462-l) is in
the same range as the accumulation rate derived by 14C dating of 0.06 ± 0.02 em a-I (PM94624) (Bauch, pers. comm.) therefore the bioturbative processes can be only of small influence.
Table 4: Accumulation rates derived from the depth profiles of 2IOPbex and the Standing crop method
Station
Accumulation Rate 21 0pb ex
Accumulation Rate Standing Crop
[g cm-2 a-I]
[g cm-2 a-I]
PM9402-3
0.15 ± 0.03
0.14 ± 0.04
PM9417-4
0.05 ± 0.02
0.09 ± 0.03
PM9442-3
0.08 ± 0.01
0.10 ± 0.04
PM9462-1
0.08 ± 0.02
0.13 ± 0.04
PM9481-2
0.19 ± 0.08
0.11 ± 0.04
Table 5: Depositional 2 10pbex fluxes of sediment cores from the shelf area of the Laptev Sea.
Station
Depositional 210pb ex Fluxes [dpm cm-2 a-I]
PM 9402-3
0.35 ± 0.02
PM 9417-4
0.22 ± 0.02
PM 9442-3
0.25 ± 0.04
PM 9462-1
0.31 ± 0.02
PM 9463-8
0.60 ± 0.05
PM 9481-2
0.26 ± 0.02
Depositional 210Pb ex fluxes in the shelf area of the Laptev Sea
At steady state, the Standing crop of excess 210Pb must be balanced by the net flux of 210Pb ex
into the sediment. The depositional 210Pbex flux can be determined as:
F = 'A. SC
F: depositional 210Pb flux [dpm cm- 2 a-I]
SC: Standing Crop [dpm cm- 2 ]
'A: decay constant of 210Pb [0.031 a-I]
(9)
The depositional 210Pbex fluxes of the investigated locations are listed in Table 5. The
atmospheric supply of 210Pb in different regions of the world ranges between 0.15 and 1.5
dpm cm-2 a-I (Graustein and Turekian, 1986; GopaJakrishnan et a!., 1973; Turekian et aI.,