

Bolshiyanov and Molodkov: Marine Pleistocene Deposits of the Taymyr Peninsula
471
shell during its burial. To perform palaeodosimetric analysis of the shell material, the analytical
line at 2.0012 (line-width Mpp U 0.22 mT, Molodkov, 1988, 1993) was separated. The doseresponse curves with the use of this signal conformed most closely to the single exponential
function.
The height of original absorption signal was used as an equivalent of the g=2.0012 centre
concentration in the shell. Quantification of the 2.0012 centre concentration was obtained from
the peak-to-peak amplitude of the relevant signal in derivative spectra of the shells by using an
overmodulation (OM) detection method (Molodkov, 1988, 1993). The microwave power used
for dosimetric reading was 2 mW with 100 kHz magnetic field modulation at 1 mT. The
palaeodose for each sample was obtained by fitting with the reciprocal exponential function
-In( -lllmax), where I and Imax are the ESR signal intensity and the intensity of the level at
saturation dose, respectively. The accumulated palaeodose, Ps, was estimated by extrapolation
of the regression line to zero ESR intensity. The saturation value of ESR intensity, Imax, was
found by iterative optimization.
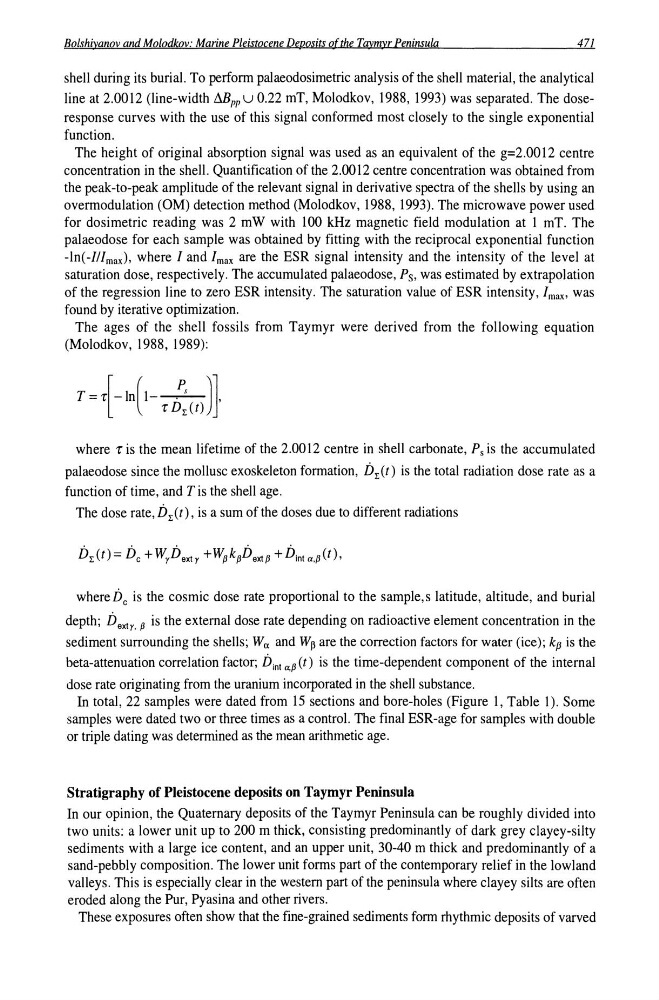
The ages of the shell fossils from Taymyr were derived from the following equation
(Molodkov, 1988, 1989):
where r is the mean lifetime of the 2.0012 centre in shell carbonate, Ps is the accumulated
palaeodose since the mollusc exoskeleton formation, D~(t) is the total radiation dose rate as a
function of time, and T is the shell age.
The dose rate, D~(t), is a sum of the doses due to different radiations
where Dc is the cosmic dose rate proportional to the sample, s latitude, altitude, and burial
depth; D extr . ~ is the external dose rate depending on radioactive element concentration in the
sediment surrounding the shells; Wu and W~ are the correction factors for water (ice); kf3 is the
beta-attenuation correlation factor; Dint a,~ (t) is the time-dependent component of the internal
dose rate originating from the uranium incorporated in the shell substance.
In total, 22 samples were dated from 15 sections and bore-holes (Figure 1, Table 1). Some
samples were dated two or three times as a control. The final ESR-age for samples with double
or triple dating was determined as the mean arithmetic age.
Stratigraphy of Pleistocene deposits on Taymyr Peninsula
In our opinion, the Quaternary deposits of the Taymyr Peninsula can be roughly divided into
two units: a lower unit up to 200 m thick, consisting predominantly of dark grey clayey-silty
sediments with a large ice content, and an upper unit, 30-40 m thick and predominantly of a
sand-pebbly composition. The lower unit forms part of the contemporary relief in the lowland
valleys. This is especially clear in the western part of the peninsula where clayey silts are often
eroded along the Pur, Pyasina and other rivers.
These exposures often show that the fine-grained sediments form rhythmic deposits of varved
471
shell during its burial. To perform palaeodosimetric analysis of the shell material, the analytical
line at 2.0012 (line-width Mpp U 0.22 mT, Molodkov, 1988, 1993) was separated. The doseresponse curves with the use of this signal conformed most closely to the single exponential
function.
The height of original absorption signal was used as an equivalent of the g=2.0012 centre
concentration in the shell. Quantification of the 2.0012 centre concentration was obtained from
the peak-to-peak amplitude of the relevant signal in derivative spectra of the shells by using an
overmodulation (OM) detection method (Molodkov, 1988, 1993). The microwave power used
for dosimetric reading was 2 mW with 100 kHz magnetic field modulation at 1 mT. The
palaeodose for each sample was obtained by fitting with the reciprocal exponential function
-In( -lllmax), where I and Imax are the ESR signal intensity and the intensity of the level at
saturation dose, respectively. The accumulated palaeodose, Ps, was estimated by extrapolation
of the regression line to zero ESR intensity. The saturation value of ESR intensity, Imax, was
found by iterative optimization.
The ages of the shell fossils from Taymyr were derived from the following equation
(Molodkov, 1988, 1989):
where r is the mean lifetime of the 2.0012 centre in shell carbonate, Ps is the accumulated
palaeodose since the mollusc exoskeleton formation, D~(t) is the total radiation dose rate as a
function of time, and T is the shell age.
The dose rate, D~(t), is a sum of the doses due to different radiations
where Dc is the cosmic dose rate proportional to the sample, s latitude, altitude, and burial
depth; D extr . ~ is the external dose rate depending on radioactive element concentration in the
sediment surrounding the shells; Wu and W~ are the correction factors for water (ice); kf3 is the
beta-attenuation correlation factor; Dint a,~ (t) is the time-dependent component of the internal
dose rate originating from the uranium incorporated in the shell substance.
In total, 22 samples were dated from 15 sections and bore-holes (Figure 1, Table 1). Some
samples were dated two or three times as a control. The final ESR-age for samples with double
or triple dating was determined as the mean arithmetic age.
Stratigraphy of Pleistocene deposits on Taymyr Peninsula
In our opinion, the Quaternary deposits of the Taymyr Peninsula can be roughly divided into
two units: a lower unit up to 200 m thick, consisting predominantly of dark grey clayey-silty
sediments with a large ice content, and an upper unit, 30-40 m thick and predominantly of a
sand-pebbly composition. The lower unit forms part of the contemporary relief in the lowland
valleys. This is especially clear in the western part of the peninsula where clayey silts are often
eroded along the Pur, Pyasina and other rivers.
These exposures often show that the fine-grained sediments form rhythmic deposits of varved