

Voinov and Zakharchuk: Large-Scale Variations o(Sea Level in the Lavtev Sea
31
stations a peak on the monthly period at is revealed in our results.
In the field of low frequencies (less than 0,00274 c/d or period at I year) resolution the
spectrum does not allow us to investigate interannual variability of the oscillations. Values of
the peaks obtained using the Fourier analysis are not so stable as the spectral ones, however,
they have a higher frequency resolution.
Results of the Fourier analysis of the residual time series revealed the following. In the range
of interannual variability the peaks for the periods 4.6, 2.9, 1.9-2.1, 1.2-1.3 and 1.05 years
were reliably expressed. On a half of the stations the fluctuations for the periods of about 11
years and 7.7 years are not present. As one can see, our results partially coincide with previous
studies (Bannov-Baykov, 1974), however, the oscillations for the periods of 5-7 and 3-4 years
are absent at most stations. It is significant that the peaks at 1.2-1.3 and 1.05 years were first
discovered in the spectra of the residual series with removed annual harmonic. We have shown
common features, but there is also a considerable variability of the spectra between the stations
because of different environmental conditions.
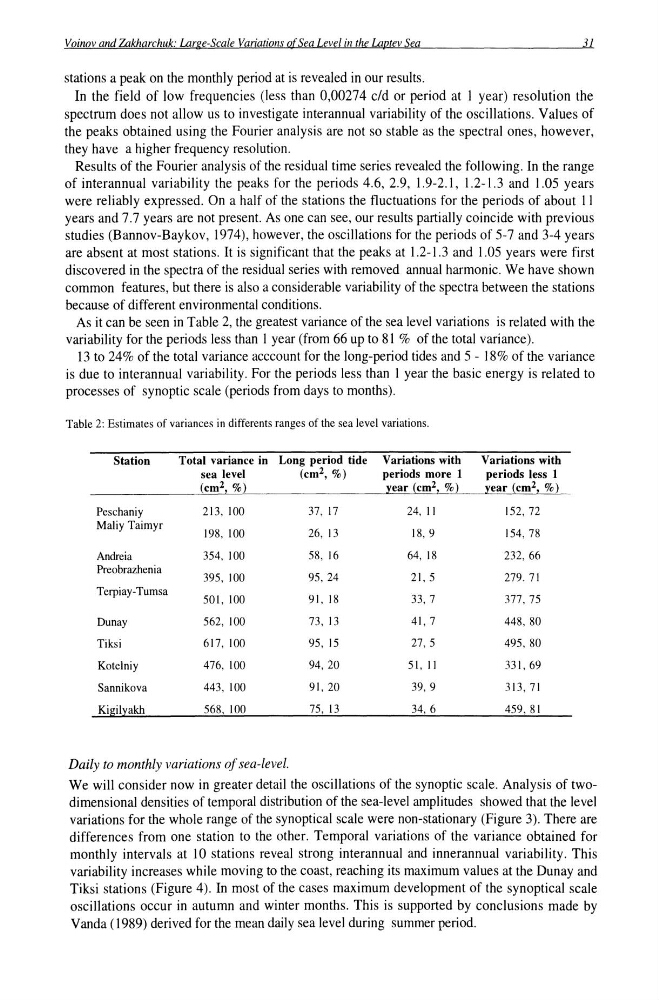
As it can be seen in Table 2, the greatest variance of the sea level variations is related with the
variability for the periods less than 1 year (from 66 up to 81 % of the total variance).
13 to 24% of the total variance acccount for the long-period tides and 5 - 18% of the variance
is due to interannual variability. For the periods less than 1 year the basic energy is related to
processes of synoptic scale (periods from days to months).
Table 2: Estimates of variances in differents ranges of the sea level variations.
Station
Total variance in Long period tide Variations with
Variations with
sea level
(cm 2 , %)
periods more 1
periods less 1
(cm2, %)
;year (cm2, %)
;year (cm2, %1
Peschaniy
213, 100
37, 17
24, II
152,72
Maliy Taimyr
198, 100
26, 13
18,9
154, 78
Andreia
354, 100
58, 16
64, 18
232, 66
Preobrazhenia
395, 100
95, 24
21,5
279.71
Terpiay-Tumsa
501,100
91, 18
33, 7
377, 75
Dunay
562, 100
73, 13
41,7
448, 80
Tiksi
617, 100
95, 15
27, 5
495, 80
Kotelniy
476, 100
94, 20
51, II
331,69
Sannikova
443, 100
91,20
39, 9
313,71
Kigilyakh
568, 100
75, 13
34, 6
459, 81
Daily to monthly variations of sea-level.
We will consider now in greater detail the oscillations of the synoptic scale. Analysis of twodimensional densities of temporal distribution of the sea-level amplitudes showed that the level
variations for the whole range of the synoptical scale were non-stationary (Figure 3). There are
differences from one station to the other. Temporal variations of the variance obtained for
monthly intervals at 10 stations reveal strong interannual and innerannual variability. This
variability increases while moving to the coast, reaching its maximum values at the Dunay and
Tiksi stations (Figure 4). In most of the cases maximum development of the synoptical scale
oscillations occur in autumn and winter months. This is supported by conclusions made by
Vanda (1989) derived for the mean daily sea level during summer period.
31
stations a peak on the monthly period at is revealed in our results.
In the field of low frequencies (less than 0,00274 c/d or period at I year) resolution the
spectrum does not allow us to investigate interannual variability of the oscillations. Values of
the peaks obtained using the Fourier analysis are not so stable as the spectral ones, however,
they have a higher frequency resolution.
Results of the Fourier analysis of the residual time series revealed the following. In the range
of interannual variability the peaks for the periods 4.6, 2.9, 1.9-2.1, 1.2-1.3 and 1.05 years
were reliably expressed. On a half of the stations the fluctuations for the periods of about 11
years and 7.7 years are not present. As one can see, our results partially coincide with previous
studies (Bannov-Baykov, 1974), however, the oscillations for the periods of 5-7 and 3-4 years
are absent at most stations. It is significant that the peaks at 1.2-1.3 and 1.05 years were first
discovered in the spectra of the residual series with removed annual harmonic. We have shown
common features, but there is also a considerable variability of the spectra between the stations
because of different environmental conditions.
As it can be seen in Table 2, the greatest variance of the sea level variations is related with the
variability for the periods less than 1 year (from 66 up to 81 % of the total variance).
13 to 24% of the total variance acccount for the long-period tides and 5 - 18% of the variance
is due to interannual variability. For the periods less than 1 year the basic energy is related to
processes of synoptic scale (periods from days to months).
Table 2: Estimates of variances in differents ranges of the sea level variations.
Station
Total variance in Long period tide Variations with
Variations with
sea level
(cm 2 , %)
periods more 1
periods less 1
(cm2, %)
;year (cm2, %)
;year (cm2, %1
Peschaniy
213, 100
37, 17
24, II
152,72
Maliy Taimyr
198, 100
26, 13
18,9
154, 78
Andreia
354, 100
58, 16
64, 18
232, 66
Preobrazhenia
395, 100
95, 24
21,5
279.71
Terpiay-Tumsa
501,100
91, 18
33, 7
377, 75
Dunay
562, 100
73, 13
41,7
448, 80
Tiksi
617, 100
95, 15
27, 5
495, 80
Kotelniy
476, 100
94, 20
51, II
331,69
Sannikova
443, 100
91,20
39, 9
313,71
Kigilyakh
568, 100
75, 13
34, 6
459, 81
Daily to monthly variations of sea-level.
We will consider now in greater detail the oscillations of the synoptic scale. Analysis of twodimensional densities of temporal distribution of the sea-level amplitudes showed that the level
variations for the whole range of the synoptical scale were non-stationary (Figure 3). There are
differences from one station to the other. Temporal variations of the variance obtained for
monthly intervals at 10 stations reveal strong interannual and innerannual variability. This
variability increases while moving to the coast, reaching its maximum values at the Dunay and
Tiksi stations (Figure 4). In most of the cases maximum development of the synoptical scale
oscillations occur in autumn and winter months. This is supported by conclusions made by
Vanda (1989) derived for the mean daily sea level during summer period.