

366
where:
A z (Bq cm- 2 )
Ao (Bq cm- 2 )
Ie (a-I)
tz (a)
ex (Bq g-l)
(I>. (cm 3 cm- 3 )
p, (g cm- 3 )
Vw (cm 3 )
M, (g)
Land-Ocean Systems in the Siberian Arctic: Dynamics and History
= integrated activity of unsupported 210Pb at depth (z);
= integrated activity of unsupported 210Pb at depth z = 0;
= decay constant of 210Pb (0.031);
= apparent age at depth (z).
= activity of unsupported 210Pb at depth x;
= porosity at depth (x)
= density of dry sediment (assumed as 2.6 g cm- 3 ),
= volume of water at depth (x)
= mass of dry sediment at depth (x)
The accumulation rate r (g cm- 2 a-I) was calculated for each depth (z) as:
(5)
The calculation becomes less precise below 5 cm depth due to the low unsupported 210Pb
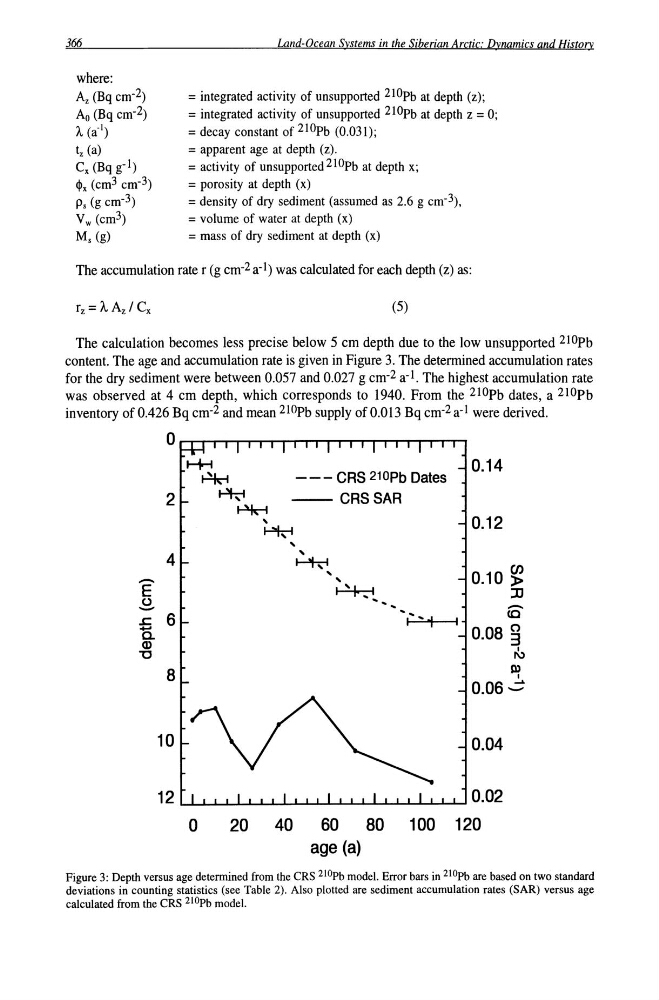
content. The age and accumulation rate is given in Figure 3. The determined accumulation rates
for the dry sediment were between 0.057 and 0.027 g cm- 2 a-I. The highest accumulation rate
was observed at 4 cm depth, which corresponds to 1940. From the 210Pb dates, a 210Pb
inventory of 0.426 Bq cm- 2 and mean 210Pb supply of 0.013 Bq cm- 2 a-I were derived.
0
t-+t
0.14
~
- - - CAS 210Pb Dates
2
~
- - CASSAA
~ ,
0.12
~ ,
4
,
~
(J)
,
-
,
0.10 »
E
~,
JJ
0
-
-
.s::. 6
I~ ~ ~
(Q
+-'
0.08 ~
a. Q)
"0
K>
8
S» I
0.06~
10
0.04
12
0.02
0
20
40
60
80
100 120
age (a)
Figure 3: Depth versus age determined from the CRS 2lOPb model. Error bars in 210pb are based on two standard
deviations in counting statistics (see Table 2). Also plotted are sediment accumulation rates (SAR) versus age
calculated from the CRS 210Pb model.
where:
A z (Bq cm- 2 )
Ao (Bq cm- 2 )
Ie (a-I)
tz (a)
ex (Bq g-l)
(I>. (cm 3 cm- 3 )
p, (g cm- 3 )
Vw (cm 3 )
M, (g)
Land-Ocean Systems in the Siberian Arctic: Dynamics and History
= integrated activity of unsupported 210Pb at depth (z);
= integrated activity of unsupported 210Pb at depth z = 0;
= decay constant of 210Pb (0.031);
= apparent age at depth (z).
= activity of unsupported 210Pb at depth x;
= porosity at depth (x)
= density of dry sediment (assumed as 2.6 g cm- 3 ),
= volume of water at depth (x)
= mass of dry sediment at depth (x)
The accumulation rate r (g cm- 2 a-I) was calculated for each depth (z) as:
(5)
The calculation becomes less precise below 5 cm depth due to the low unsupported 210Pb
content. The age and accumulation rate is given in Figure 3. The determined accumulation rates
for the dry sediment were between 0.057 and 0.027 g cm- 2 a-I. The highest accumulation rate
was observed at 4 cm depth, which corresponds to 1940. From the 210Pb dates, a 210Pb
inventory of 0.426 Bq cm- 2 and mean 210Pb supply of 0.013 Bq cm- 2 a-I were derived.
0
t-+t
0.14
~
- - - CAS 210Pb Dates
2
~
- - CASSAA
~ ,
0.12
~ ,
4
,
~
(J)
,
-
,
0.10 »
E
~,
JJ
0
-
-
.s::. 6
I~ ~ ~
(Q
+-'
0.08 ~
a. Q)
"0
K>
8
S» I
0.06~
10
0.04
12
0.02
0
20
40
60
80
100 120
age (a)
Figure 3: Depth versus age determined from the CRS 2lOPb model. Error bars in 210pb are based on two standard
deviations in counting statistics (see Table 2). Also plotted are sediment accumulation rates (SAR) versus age
calculated from the CRS 210Pb model.