

26
Land-Ocean Systems in the Siberian Arctic: Dynamics and History
Data and methods
In order to investigate the above-mentioned aspects of the problem, time series of the daily
mean values of the sea level records for the years 1962-1984 at 10 coastal stations in the Laptev
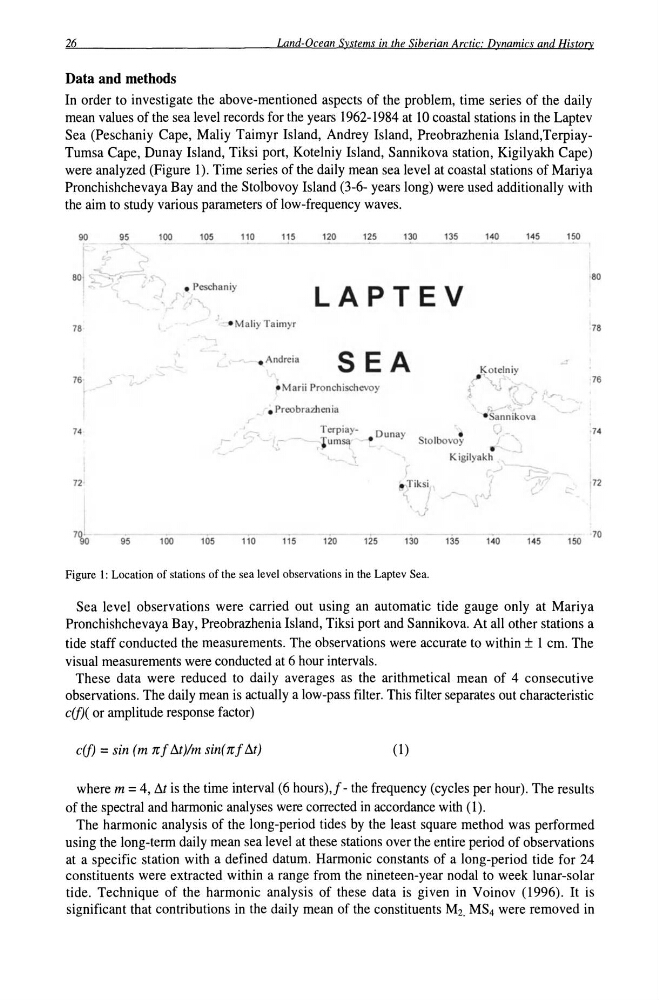
Sea (Peschaniy Cape, Maliy Taimyr Island, Andrey Island, Preobrazhenia Island,TerpiayTumsa Cape, Dunay Island, Tiksi port, Kotelniy Island, Sannikova station, Kigilyakh Cape)
were analyzed (Figure 1). Time series of the daily mean sea level at coastal stations of Mariya
Pronchishchevaya Bay and the Stolbovoy Island (3-6- years long) were used additionally with
the aim to study various parameters of low-frequency waves.
90
95
100
105
110
115
120
125
130
135
140
145
150
80
..;-;'.J. -'.~,
80
~
• Peschaniy
L A P T E V
78
- • Maliy Taimyr
78
_ . Andreia
S E A
KOlelniy
76
( '-"" ,76
~ Marii Pronchischevoy
~
,.'.r
• Preobrazhen ia
f-- - -
· Sannikova
74
Terpiay- • Dunay Slolbovoy
J
74
l
',- - --; Ium~
"
•
Kigilyakh
I_
n
~Tiksi
172
~
I
t')
"
70l
f
105
110
120
125
130 - -1-35
140
70
90
95
100
115
145
150
Figure 1: Location of stations of the sea level observations in the Laptev Sea.
Sea level observations were carried out using an automatic tide gauge only at Mariya
Pronchishchevaya Bay, Preobrazhenia Island, Tiksi port and Sannikova. At all other stations a
tide staff conducted the measurements. The observations were accurate to within ± 1 cm. The
visual measurements were conducted at 6 hour intervals.
These data were reduced to daily averages as the arithmetical mean of 4 consecutive
observations. The daily mean is actually a low-pass filter. This filter separates out characteristic
e(j)( or amplitude response factor)
e(f) = sin (m ref !:J.t)lm sine ref!:J.t)
(1)
where m = 4, !:J.t is the time interval (6 hours),f - the frequency (cycles per hour). The results
of the spectral and harmonic analyses were corrected in accordance with (1).
The harmonic analysis of the long-period tides by the least square method was performed
using the long-term daily mean sea level at these stations over the entire period of observations
at a specific station with a defined datum. Harmonic constants of a long-period tide for 24
constituents were extracted within a range from the nineteen-year nodal to week lunar-solar
tide. Technique of the harmonic analysis of these data is given in Voinov (1996). It is
significant that contributions in the daily mean of the constituents M2, MS4 were removed in
Land-Ocean Systems in the Siberian Arctic: Dynamics and History
Data and methods
In order to investigate the above-mentioned aspects of the problem, time series of the daily
mean values of the sea level records for the years 1962-1984 at 10 coastal stations in the Laptev
Sea (Peschaniy Cape, Maliy Taimyr Island, Andrey Island, Preobrazhenia Island,TerpiayTumsa Cape, Dunay Island, Tiksi port, Kotelniy Island, Sannikova station, Kigilyakh Cape)
were analyzed (Figure 1). Time series of the daily mean sea level at coastal stations of Mariya
Pronchishchevaya Bay and the Stolbovoy Island (3-6- years long) were used additionally with
the aim to study various parameters of low-frequency waves.
90
95
100
105
110
115
120
125
130
135
140
145
150
80
..;-;'.J. -'.~,
80
~
• Peschaniy
L A P T E V
78
- • Maliy Taimyr
78
_ . Andreia
S E A
KOlelniy
76
( '-"" ,76
~ Marii Pronchischevoy
~
,.'.r
• Preobrazhen ia
f-- - -
· Sannikova
74
Terpiay- • Dunay Slolbovoy
J
74
l
',- - --; Ium~
"
•
Kigilyakh
I_
n
~Tiksi
172
~
I
t')
"
70l
f
105
110
120
125
130 - -1-35
140
70
90
95
100
115
145
150
Figure 1: Location of stations of the sea level observations in the Laptev Sea.
Sea level observations were carried out using an automatic tide gauge only at Mariya
Pronchishchevaya Bay, Preobrazhenia Island, Tiksi port and Sannikova. At all other stations a
tide staff conducted the measurements. The observations were accurate to within ± 1 cm. The
visual measurements were conducted at 6 hour intervals.
These data were reduced to daily averages as the arithmetical mean of 4 consecutive
observations. The daily mean is actually a low-pass filter. This filter separates out characteristic
e(j)( or amplitude response factor)
e(f) = sin (m ref !:J.t)lm sine ref!:J.t)
(1)
where m = 4, !:J.t is the time interval (6 hours),f - the frequency (cycles per hour). The results
of the spectral and harmonic analyses were corrected in accordance with (1).
The harmonic analysis of the long-period tides by the least square method was performed
using the long-term daily mean sea level at these stations over the entire period of observations
at a specific station with a defined datum. Harmonic constants of a long-period tide for 24
constituents were extracted within a range from the nineteen-year nodal to week lunar-solar
tide. Technique of the harmonic analysis of these data is given in Voinov (1996). It is
significant that contributions in the daily mean of the constituents M2, MS4 were removed in