

22
Land-Ocean Systems in the Siberian Arctic: Dynamics and History
100
80
60
a)
40
,
140
20
120
0
100
-20
,/
,
80
/
E
~
60
:40
20
100
0
b)
80
-20
60
-40
40
- - -1
20
- - --2
0
-20
,/
,
-40
-60~.-----.------.-----.-----.------.-----.-----5 - Aug 6 - Aug 7 - Aug 8 - Aug 9 - Aug 10 - Aug 11 - Aug 12 - Aug
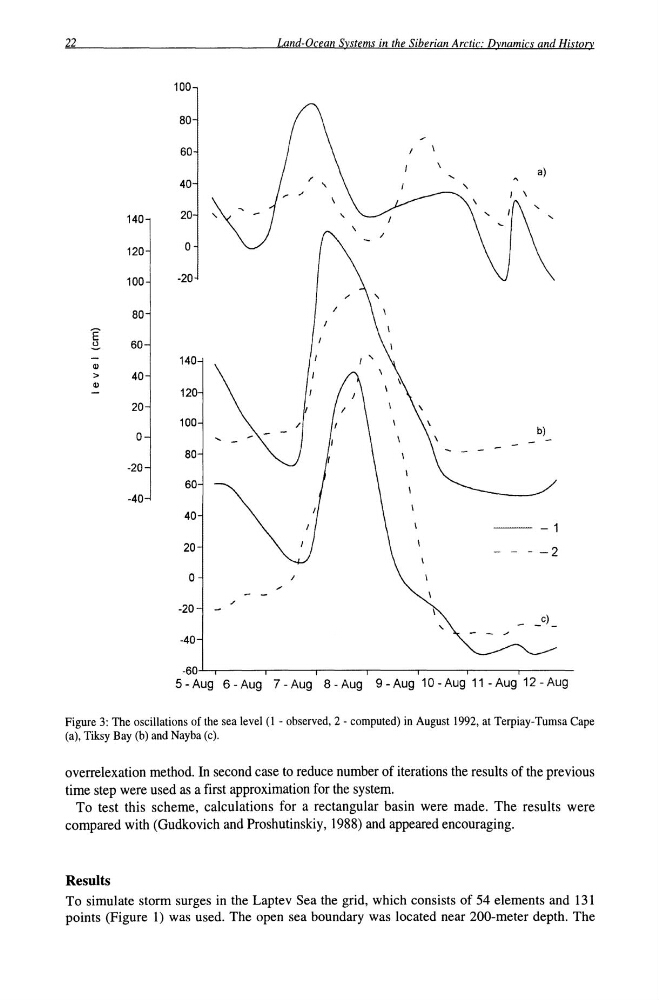
Figure 3: The oscillations of the sea level (1- observed, 2 - computed) in August 1992, at Terpiay-Tumsa Cape
(a), Tiksy Bay (b) and Nayba (c).
overrelexation method. In second case to reduce number of iterations the results of the previous
time step were used as a first approximation for the system.
To test this scheme, calculations for a rectangular basin were made. The results were
compared with (Gudkovich and Proshutinskiy, 1988) and appeared encouraging.
Results
To simulate storm surges in the Laptev Sea the grid, which consists of 54 elements and 131
points (Figure 1) was used. The open sea boundary was located near 200-meter depth. The
Land-Ocean Systems in the Siberian Arctic: Dynamics and History
100
80
60
a)
40
,
140
20
120
0
100
-20
,/
,
80
/
E
~
60
:40
20
100
0
b)
80
-20
60
-40
40
- - -1
20
- - --2
0
-20
,/
,
-40
-60~.-----.------.-----.-----.------.-----.-----5 - Aug 6 - Aug 7 - Aug 8 - Aug 9 - Aug 10 - Aug 11 - Aug 12 - Aug
Figure 3: The oscillations of the sea level (1- observed, 2 - computed) in August 1992, at Terpiay-Tumsa Cape
(a), Tiksy Bay (b) and Nayba (c).
overrelexation method. In second case to reduce number of iterations the results of the previous
time step were used as a first approximation for the system.
To test this scheme, calculations for a rectangular basin were made. The results were
compared with (Gudkovich and Proshutinskiy, 1988) and appeared encouraging.
Results
To simulate storm surges in the Laptev Sea the grid, which consists of 54 elements and 131
points (Figure 1) was used. The open sea boundary was located near 200-meter depth. The