

Boike and Overduin: Seasonal Changes in Hvdrology. Energy Balance and Chemistry
303
ground during spring. The gradual temperature increase suggests conduction as the major
process of heat transport. During autumn freeze-back, a large proportion of latent heat was
removed from a zone where small temperature gradients existed with opposite directions. This
suggests that convective processes are responsible for efficient energy transfer within the
unfrozen region of the active layer (Boike et aI., 1998).
A simple water and energy balance model allowed quantification of the individual energy and
water balance components through the ground surface. It was found that the dominant heat loss
components in this system during spring and summer were sensible and latent heat fluxes into
the atmosphere. During fall, the dominant heat source was phase change produced by active
layer freeze-back.
The average amount of energy consumed by evaporation during the spring and summer
period ranged from approximately 25 to 50 % of the total available energy. The third largest
energy sink was the thawing of the active layer which can consume more than 20 % of the total
net radiation. This term was largest when the active layer was driest because of the soil's
strongly decreased hydraulic conductivity and the loss due to evaporation was therefore
reduced. Of the available energy transferred into the ground, between 70 to 100 % was
consumed for thawing and the rest for the warming of the ground.
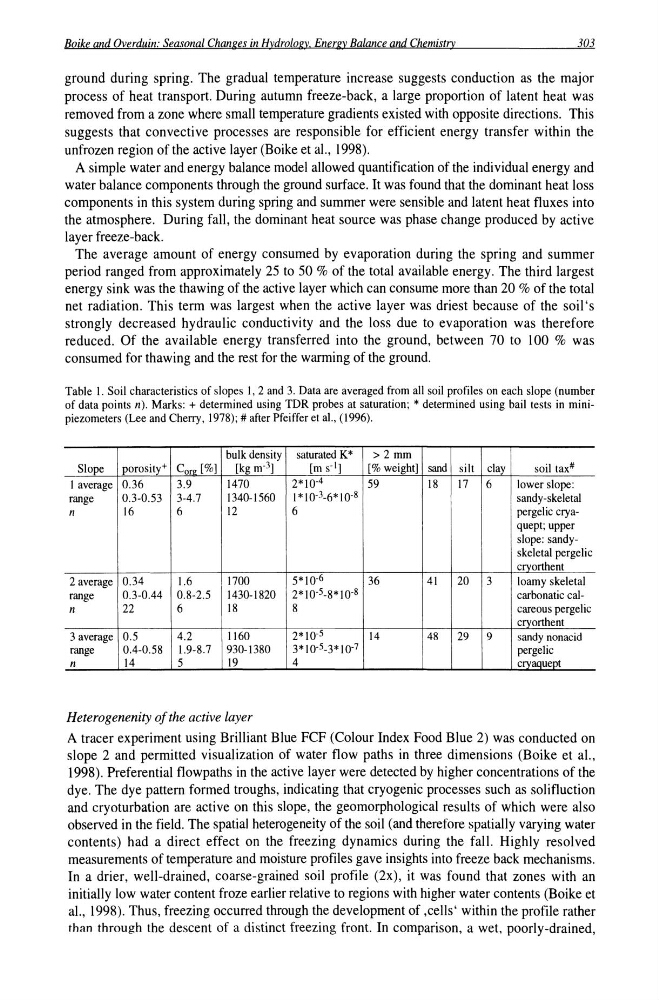
Table I. Soil characteristics of slopes I, 2 and 3. Data are averaged from all soil profiles on each slope (number
of data points n). Marks: + determined using TDR probes at saturation; * determined using bail tests in minipiezometers (Lee and Cherry, 1978); # after Pfeiffer et aI., (1996).
bulk density saturated K*
>2mm
Slope
porosity+ Cor~ [%]
[kgm-3]
[m s-']
[% weight] sand silt clay
soil tax#
1 average 0.36
3.9
1470
2*10-4
59
18
17
6
lower slope:
range
0.3-0.53 3-4.7
1340-1560
1 * 1 0-3-6* 10-8
sandy-skeletal
n
16
6
12
6
pergelic cryaquept; upper
slope: sandyskeletal pergelic
cryorthent
2 average 0.34
1.6
1700
5*10-6
36
41
20
3
loamy skeletal
range
0.3-0.44 0.8-2.5
1430-1820 2*10-5-8*10-8
carbonatic cain
22
6
18
8
careous pergelic
cryorthent
3 average 0.5
4.2
1160
2* 10-5
14
48
29
9
sandy nonacid
range
0.4-0.58 1.9-8.7 930-1380
3* 10-5-3* 10-7
pergelic
n
14
5
19
4
cryaquept
Heterogenenity of the active layer
A tracer experiment using Brilliant Blue FCF (Colour Index Food Blue 2) was conducted on
slope 2 and permitted visualization of water flow paths in three dimensions (Boike et a!.,
1998). Preferential flowpaths in the active layer were detected by higher concentrations of the
dye. The dye pattern formed troughs, indicating that cryogenic processes such as solifluction
and cryoturbation are active on this slope, the geomorphological results of which were also
observed in the field. The spatial heterogeneity of the soil (and therefore spatially varying water
contents) had a direct effect on the freezing dynamics during the fall. Highly resolved
measurements of temperature and moisture profiles gave insights into freeze back mechanisms.
In a drier, well-drained, coarse-grained soil profile (2x), it was found that zones with an
initially low water content froze earlier relative to regions with higher water contents (Boike et
a!., 1998). Thus, freezing occurred through the development of ,cells' within the profile rather
than through the descent of a distinct freezing front. In comparison, a wet, poorly-drained,
303
ground during spring. The gradual temperature increase suggests conduction as the major
process of heat transport. During autumn freeze-back, a large proportion of latent heat was
removed from a zone where small temperature gradients existed with opposite directions. This
suggests that convective processes are responsible for efficient energy transfer within the
unfrozen region of the active layer (Boike et aI., 1998).
A simple water and energy balance model allowed quantification of the individual energy and
water balance components through the ground surface. It was found that the dominant heat loss
components in this system during spring and summer were sensible and latent heat fluxes into
the atmosphere. During fall, the dominant heat source was phase change produced by active
layer freeze-back.
The average amount of energy consumed by evaporation during the spring and summer
period ranged from approximately 25 to 50 % of the total available energy. The third largest
energy sink was the thawing of the active layer which can consume more than 20 % of the total
net radiation. This term was largest when the active layer was driest because of the soil's
strongly decreased hydraulic conductivity and the loss due to evaporation was therefore
reduced. Of the available energy transferred into the ground, between 70 to 100 % was
consumed for thawing and the rest for the warming of the ground.
Table I. Soil characteristics of slopes I, 2 and 3. Data are averaged from all soil profiles on each slope (number
of data points n). Marks: + determined using TDR probes at saturation; * determined using bail tests in minipiezometers (Lee and Cherry, 1978); # after Pfeiffer et aI., (1996).
bulk density saturated K*
>2mm
Slope
porosity+ Cor~ [%]
[kgm-3]
[m s-']
[% weight] sand silt clay
soil tax#
1 average 0.36
3.9
1470
2*10-4
59
18
17
6
lower slope:
range
0.3-0.53 3-4.7
1340-1560
1 * 1 0-3-6* 10-8
sandy-skeletal
n
16
6
12
6
pergelic cryaquept; upper
slope: sandyskeletal pergelic
cryorthent
2 average 0.34
1.6
1700
5*10-6
36
41
20
3
loamy skeletal
range
0.3-0.44 0.8-2.5
1430-1820 2*10-5-8*10-8
carbonatic cain
22
6
18
8
careous pergelic
cryorthent
3 average 0.5
4.2
1160
2* 10-5
14
48
29
9
sandy nonacid
range
0.4-0.58 1.9-8.7 930-1380
3* 10-5-3* 10-7
pergelic
n
14
5
19
4
cryaquept
Heterogenenity of the active layer
A tracer experiment using Brilliant Blue FCF (Colour Index Food Blue 2) was conducted on
slope 2 and permitted visualization of water flow paths in three dimensions (Boike et a!.,
1998). Preferential flowpaths in the active layer were detected by higher concentrations of the
dye. The dye pattern formed troughs, indicating that cryogenic processes such as solifluction
and cryoturbation are active on this slope, the geomorphological results of which were also
observed in the field. The spatial heterogeneity of the soil (and therefore spatially varying water
contents) had a direct effect on the freezing dynamics during the fall. Highly resolved
measurements of temperature and moisture profiles gave insights into freeze back mechanisms.
In a drier, well-drained, coarse-grained soil profile (2x), it was found that zones with an
initially low water content froze earlier relative to regions with higher water contents (Boike et
a!., 1998). Thus, freezing occurred through the development of ,cells' within the profile rather
than through the descent of a distinct freezing front. In comparison, a wet, poorly-drained,