

230
Land-Ocean Systems in the Siberian Arctic: Dynamics and History
the range of 6.5 to 19.5 with an average of 9.2.
100
•
1200
Sediment Load (mg/l)
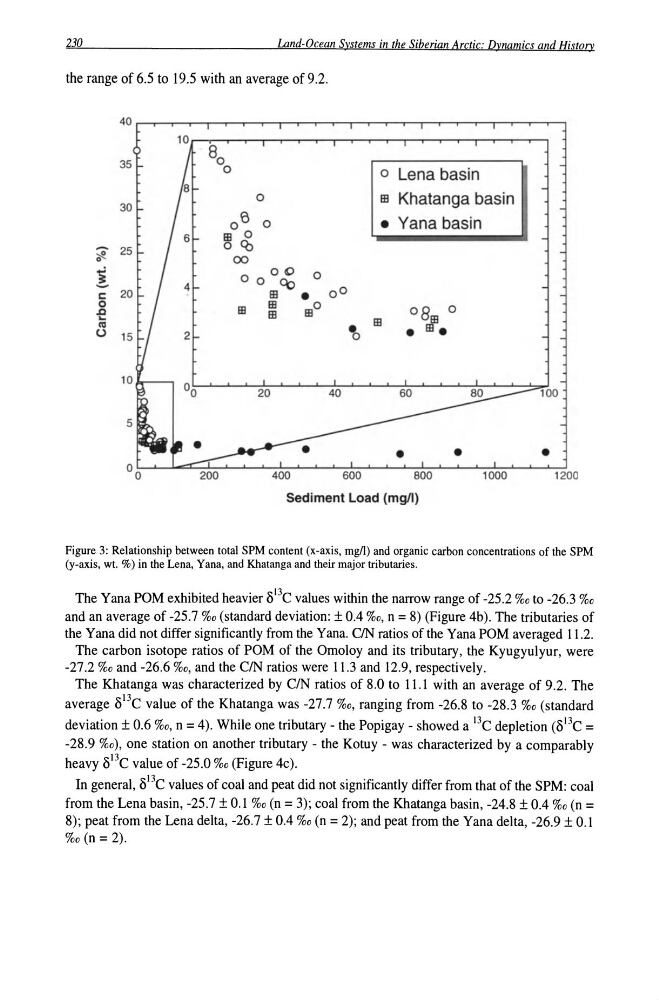
Figure 3: Relationship between total SPM content (x-axis, mgn) and organic carbon concentrations of the SPM
(y-axis, wt. %) in the Lena, Yana, and Khatanga and their major tributaries.
The Yana paM exhibited heavier I)l3C values within the narrow range of -25.2 %0 to -26.3 %0
and an average of -25.7 %0 (standard deviation: ± 0.4 %0, n = 8) (Figure 4b). The tributaries of
the Yana did not differ significantly from the Yana. CIN ratios of the Yana paM averaged 11.2.
The carbon isotope ratios of paM of the Omoloy and its tributary, the Kyugyulyur, were
-27.2 %0 and -26.6 %0, and the CIN ratios were 11.3 and 12.9, respectively.
The Khatanga was characterized by CIN ratios of 8.0 to 11.1 with an average of 9.2. The
average I)l3C value of the Khatanga was -27.7 %0, ranging from -26.8 to -28.3 %0 (standard
deviation ± 0.6 %0, n = 4). While one tributary - the Popigay - showed a 13C depletion (1)13C =
-28.9 %0), one station on another tributary - the Kotuy - was characterized by a comparably
heavy 1)13C value of -25.0 %0 (Figure 4c).
In general, 1)13C values of coal and peat did not significantly differ from that of the SPM: coal
from the Lena basin, -25.7 ± 0.1 %0 (n = 3); coal from the Khatanga basin, -24.8 ± 0.4 %0 (n =
8); peat from the Lena delta, -26.7 ± 0.4 %0 (n = 2); and peat from the Yana delta, -26.9 ± 0.1
%0 (n = 2).
Land-Ocean Systems in the Siberian Arctic: Dynamics and History
the range of 6.5 to 19.5 with an average of 9.2.
100
•
1200
Sediment Load (mg/l)
Figure 3: Relationship between total SPM content (x-axis, mgn) and organic carbon concentrations of the SPM
(y-axis, wt. %) in the Lena, Yana, and Khatanga and their major tributaries.
The Yana paM exhibited heavier I)l3C values within the narrow range of -25.2 %0 to -26.3 %0
and an average of -25.7 %0 (standard deviation: ± 0.4 %0, n = 8) (Figure 4b). The tributaries of
the Yana did not differ significantly from the Yana. CIN ratios of the Yana paM averaged 11.2.
The carbon isotope ratios of paM of the Omoloy and its tributary, the Kyugyulyur, were
-27.2 %0 and -26.6 %0, and the CIN ratios were 11.3 and 12.9, respectively.
The Khatanga was characterized by CIN ratios of 8.0 to 11.1 with an average of 9.2. The
average I)l3C value of the Khatanga was -27.7 %0, ranging from -26.8 to -28.3 %0 (standard
deviation ± 0.6 %0, n = 4). While one tributary - the Popigay - showed a 13C depletion (1)13C =
-28.9 %0), one station on another tributary - the Kotuy - was characterized by a comparably
heavy 1)13C value of -25.0 %0 (Figure 4c).
In general, 1)13C values of coal and peat did not significantly differ from that of the SPM: coal
from the Lena basin, -25.7 ± 0.1 %0 (n = 3); coal from the Khatanga basin, -24.8 ± 0.4 %0 (n =
8); peat from the Lena delta, -26.7 ± 0.4 %0 (n = 2); and peat from the Yana delta, -26.9 ± 0.1
%0 (n = 2).