

30
20
10
0
0 20
Percentage
40 60 80
200 Ma
100
Crustal age [m.yrs]
120 140 160 180 200
30
20
10
0
0 20
Percentage
40 60 80
160 Ma
100
Crustal age [m.yrs]
120 140 160 180 200
30
20
10
0
0 20
Percentage
40 60 80
120 Ma
100
Crustal age [m.yrs]
120 140 160 180 200
30
20
10
0
0 20
Percentage
40 60 80
80 Ma
100
Crustal age [m.yrs]
120 140 160 180 200
30
20
10
0
0 20
Percentage
40 60 80
40 Ma
100
Crustal age [m.yrs]
120 140 160 180 200
30
20
10
0
0 20
Percentage
40 60 80
0 Ma
100
Crustal age [m.yrs]
120 140 160 180 200
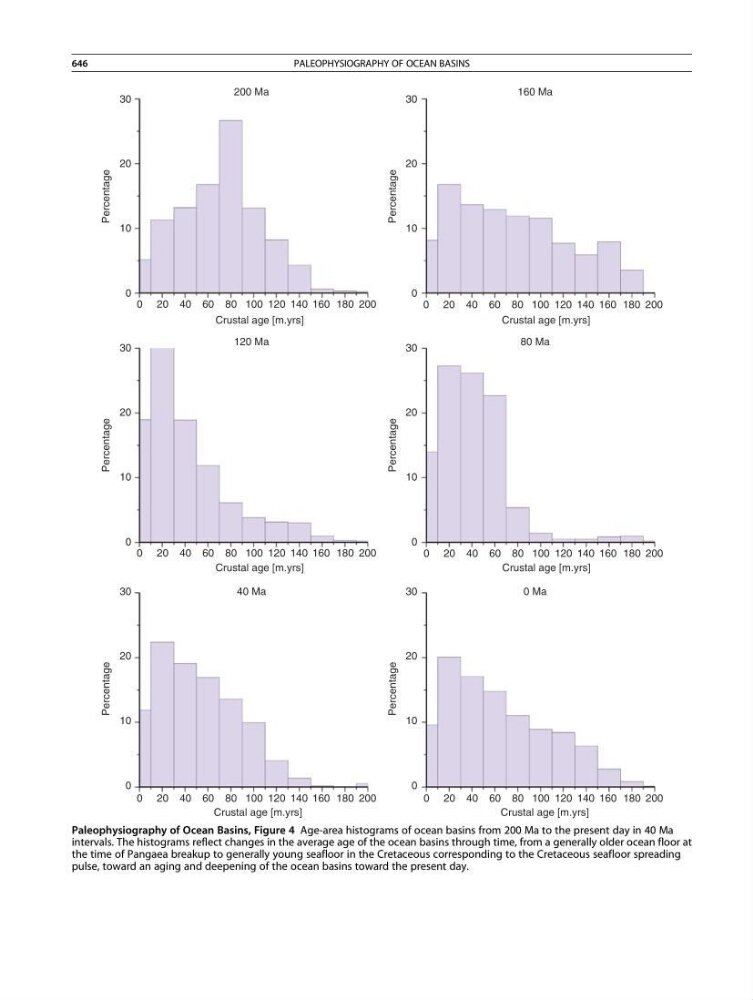
Paleophysiography of Ocean Basins, Figure 4 Age-area histograms of ocean basins from 200 Ma to the present day in 40 Ma
intervals. The histograms reflect changes in the average age of the ocean basins through time, from a generally older ocean floor at
the time of Pangaea breakup to generally young seafloor in the Cretaceous corresponding to the Cretaceous seafloor spreading
pulse, toward an aging and deepening of the ocean basins toward the present day.
646
PALEOPHYSIOGRAPHY OF OCEAN BASINS
20
10
0
0 20
Percentage
40 60 80
200 Ma
100
Crustal age [m.yrs]
120 140 160 180 200
30
20
10
0
0 20
Percentage
40 60 80
160 Ma
100
Crustal age [m.yrs]
120 140 160 180 200
30
20
10
0
0 20
Percentage
40 60 80
120 Ma
100
Crustal age [m.yrs]
120 140 160 180 200
30
20
10
0
0 20
Percentage
40 60 80
80 Ma
100
Crustal age [m.yrs]
120 140 160 180 200
30
20
10
0
0 20
Percentage
40 60 80
40 Ma
100
Crustal age [m.yrs]
120 140 160 180 200
30
20
10
0
0 20
Percentage
40 60 80
0 Ma
100
Crustal age [m.yrs]
120 140 160 180 200
Paleophysiography of Ocean Basins, Figure 4 Age-area histograms of ocean basins from 200 Ma to the present day in 40 Ma
intervals. The histograms reflect changes in the average age of the ocean basins through time, from a generally older ocean floor at
the time of Pangaea breakup to generally young seafloor in the Cretaceous corresponding to the Cretaceous seafloor spreading
pulse, toward an aging and deepening of the ocean basins toward the present day.
646
PALEOPHYSIOGRAPHY OF OCEAN BASINS