

III. Sediment Transport
[(s- 1)gq 1/3
D. = d35 t--~)
81
3.4
Comparison of Prediction Methods
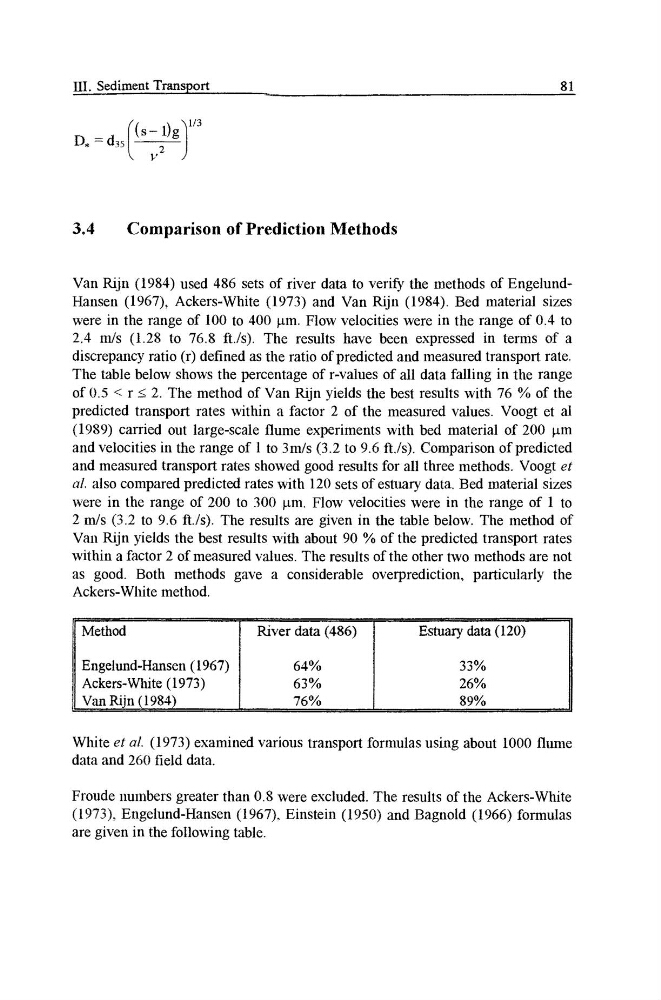
Van Rijn (1984) used 486 sets of river data to verify the methods of EngelundHansen (1967), Ackers-White (1973) and Van Rijn (1984). Bed material sizes
were in the range of 100 to 400 ~tm. Flow velocities were in the range of 0.4 to
2.4 m/s (1.28 to 76.8 ft./s). The results have been expressed in terms of a
discrepancy ratio (r) defined as the ratio of predicted and measured transport rate.
The table below shows the percentage of r-values of all data falling in the range
of 0.5 < r _< 2. The method of Van Rijn yields the best results with 76 % of the
predicted transport rates within a factor 2 of the measured values. Voogt et al
(1989) carried out large-scale flume experiments with bed material of 200 p.m
and velocities in the range of I to 3m/s (3.2 to 9.6 ft./s). Comparison of predicted
and measured transport rates showed good results for all three methods. Voogt et
al. also compared predicted rates with 120 sets of estuary data. Bed material sizes
were in the range of 200 to 300 gm. Flow velocities were in the range of 1 to
2 m/s (3.2 to 9.6 ft./s). The results are given in the table below. The method of
Van Rijn yields the best results with about 90 % of the predicted transport rates
within a factor 2 of measured values. The results of the other two methods are not
as good. Both methods gave a considerable overprediction, particularly the
Ackers-White method.
Me Tg
Engelund-Hansen (1967) ]
64%o
]
33%
Ackers-White (1973)
]
63%
]
26%
V,'m Rfn (1984)
89%
White et al. (1973) examined various transport formulas using about 1000 flume
data and 260 field data.
Froude numbers greater than 0.8 were excluded. The results of the Ackers-White
(1973), Engelund-Hansen (1967), Einstein (1950) and Bagnold (1966) formulas
are given in the following table.
[(s- 1)gq 1/3
D. = d35 t--~)
81
3.4
Comparison of Prediction Methods
Van Rijn (1984) used 486 sets of river data to verify the methods of EngelundHansen (1967), Ackers-White (1973) and Van Rijn (1984). Bed material sizes
were in the range of 100 to 400 ~tm. Flow velocities were in the range of 0.4 to
2.4 m/s (1.28 to 76.8 ft./s). The results have been expressed in terms of a
discrepancy ratio (r) defined as the ratio of predicted and measured transport rate.
The table below shows the percentage of r-values of all data falling in the range
of 0.5 < r _< 2. The method of Van Rijn yields the best results with 76 % of the
predicted transport rates within a factor 2 of the measured values. Voogt et al
(1989) carried out large-scale flume experiments with bed material of 200 p.m
and velocities in the range of I to 3m/s (3.2 to 9.6 ft./s). Comparison of predicted
and measured transport rates showed good results for all three methods. Voogt et
al. also compared predicted rates with 120 sets of estuary data. Bed material sizes
were in the range of 200 to 300 gm. Flow velocities were in the range of 1 to
2 m/s (3.2 to 9.6 ft./s). The results are given in the table below. The method of
Van Rijn yields the best results with about 90 % of the predicted transport rates
within a factor 2 of measured values. The results of the other two methods are not
as good. Both methods gave a considerable overprediction, particularly the
Ackers-White method.
Me Tg
Engelund-Hansen (1967) ]
64%o
]
33%
Ackers-White (1973)
]
63%
]
26%
V,'m Rfn (1984)
89%
White et al. (1973) examined various transport formulas using about 1000 flume
data and 260 field data.
Froude numbers greater than 0.8 were excluded. The results of the Ackers-White
(1973), Engelund-Hansen (1967), Einstein (1950) and Bagnold (1966) formulas
are given in the following table.