

!I! . Sediment Transport
141
in which"
y = distance from the intersection of the erosion profile and storm surge level
in m.
h = depth below storm surge level in m.
For conditions with other values for Hos and w, but approximately the same wave
steepness the erosion profile is
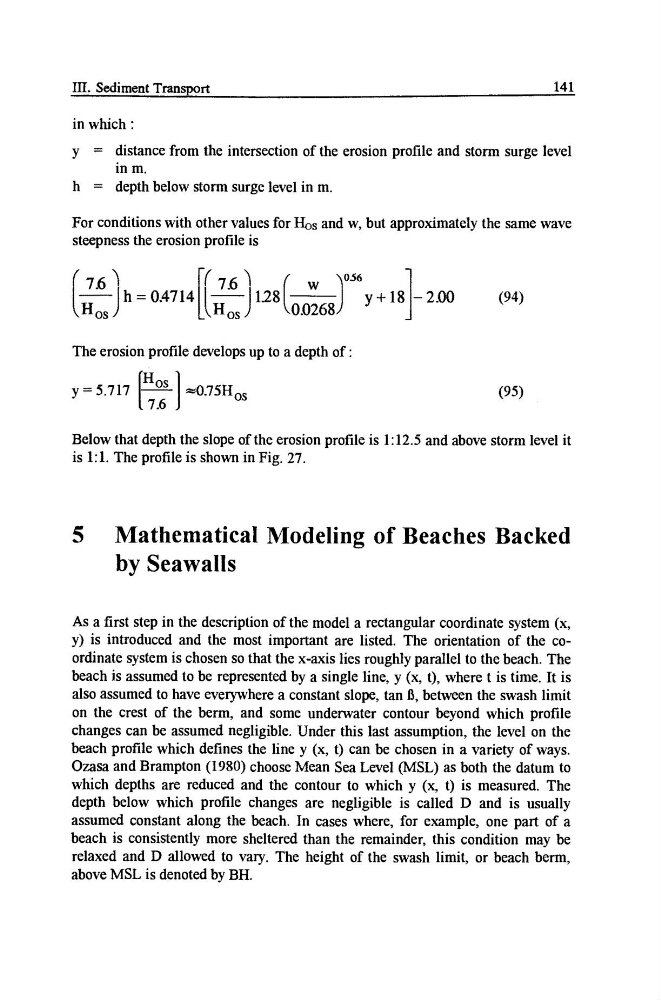
t~:~ J h = 0.4714 [t~-os J 128 [~)
y+18- 2.00
(94)
The erosion profile develops up to a depth of :
/TT
"~
y= 5.717
/ "0.75==
(95)
[7.6 J
Below that depth the slope of the erosion profile is 1:12.5 and above storm level it
is 1:1. The profile is shown in Fig. 27.
5 Mathematical Modeling of Beaches Backed
by Seawalls
As a first step in the description of the model a rectangular coordinate system (x,
y) is introduced and the most important are listed. The orientation of the coordinate system is chosen so that the x-axis lies roughly parallel to the beach. The
beach is assumed to be represented by a single line, y (x, t), where t is time. It is
also assumed to have everywhere a constant slope, tan 1, between the swash limit
on the crest of the berm, and some underwater contour beyond which profile
changes can be assumed negligible. Under this last assumption, the level on the
beach profile which defines the line y (x, t) can be chosen in a variety of ways.
Ozasa and Brampton (1980) choose Mean Sea Level (MSL) as both the datum to
which depths are reduced and the contour to which y (x, t) is measured. The
depth below which profile changes are negligible is called D and is usually
assumed constant along the beach. In cases where, for example, one part of a
beach is consistently more sheltered than the remainder, this condition may be
relaxed and D allowed to vary. The height of the swash limit, or beach berm,
above MSL is denoted by BH.
141
in which"
y = distance from the intersection of the erosion profile and storm surge level
in m.
h = depth below storm surge level in m.
For conditions with other values for Hos and w, but approximately the same wave
steepness the erosion profile is
t~:~ J h = 0.4714 [t~-os J 128 [~)
y+18- 2.00
(94)
The erosion profile develops up to a depth of :
/TT
"~
y= 5.717
/ "0.75==
(95)
[7.6 J
Below that depth the slope of the erosion profile is 1:12.5 and above storm level it
is 1:1. The profile is shown in Fig. 27.
5 Mathematical Modeling of Beaches Backed
by Seawalls
As a first step in the description of the model a rectangular coordinate system (x,
y) is introduced and the most important are listed. The orientation of the coordinate system is chosen so that the x-axis lies roughly parallel to the beach. The
beach is assumed to be represented by a single line, y (x, t), where t is time. It is
also assumed to have everywhere a constant slope, tan 1, between the swash limit
on the crest of the berm, and some underwater contour beyond which profile
changes can be assumed negligible. Under this last assumption, the level on the
beach profile which defines the line y (x, t) can be chosen in a variety of ways.
Ozasa and Brampton (1980) choose Mean Sea Level (MSL) as both the datum to
which depths are reduced and the contour to which y (x, t) is measured. The
depth below which profile changes are negligible is called D and is usually
assumed constant along the beach. In cases where, for example, one part of a
beach is consistently more sheltered than the remainder, this condition may be
relaxed and D allowed to vary. The height of the swash limit, or beach berm,
above MSL is denoted by BH.