

128
R.H. Charlier and Chr. P. De Meyer
where :
A = shape factor, depending on the stability characteristics of the bed material
m = value of the exponent, depending on the force considered (see Fig. 25)
Moore (1982) evaluated published beach profiles comprising a wide range of
sand sizes, and found that A = D I/3, as was reported by Dean (1983b) and shown
in Fig. 26. Combination of the above results gives :
h = B y2/3 D1/3
(67)
where :
B = an unknown factor which is likely to be dependent on several variables, like
wave climate, water level variations, coastal currents, etc..
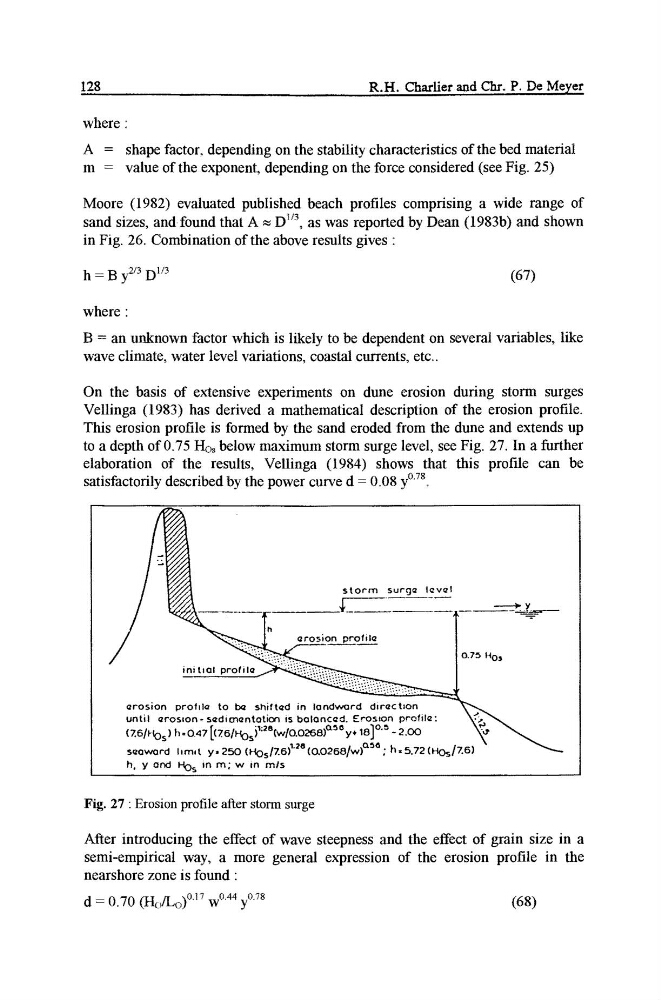
On the basis of extensive experiments on dune erosion during storm surges
Vellinga (1983) has derived a mathematical description of the erosion profile,
This erosion profile is formed by the sand eroded from the dune and extends up
to a depth of 0.75 Ho~ below maximum storm surge level, see Fig. 27. In a further
elaboration of the results, Vellinga (1984) shows that this profile can be
satisfactorily described by the power curve d = 0°08 yOTg°
storm surge level
T
h
~. ~rosion profile
]
/
/ °.'3 .o,
~i t,ol prome
~~~
ndword dtrec t~on
seoward h m, t y, 250 (HoslZ6) "28 (CtO26a/w) a~: h. 5.72 (HoslZ6)
h, y ond ~
in m; w in mls
Fig. 27 : Erosion profile after storm surge
After introducing the effect of wave steepness and the effect of grain size in a
semi-empirical way, a more general expression of the erosion profile in the
nearshore zone is :found :
d = 0.70 (Ho/Lo) °'17 w TM yO.78
(68)
R.H. Charlier and Chr. P. De Meyer
where :
A = shape factor, depending on the stability characteristics of the bed material
m = value of the exponent, depending on the force considered (see Fig. 25)
Moore (1982) evaluated published beach profiles comprising a wide range of
sand sizes, and found that A = D I/3, as was reported by Dean (1983b) and shown
in Fig. 26. Combination of the above results gives :
h = B y2/3 D1/3
(67)
where :
B = an unknown factor which is likely to be dependent on several variables, like
wave climate, water level variations, coastal currents, etc..
On the basis of extensive experiments on dune erosion during storm surges
Vellinga (1983) has derived a mathematical description of the erosion profile,
This erosion profile is formed by the sand eroded from the dune and extends up
to a depth of 0.75 Ho~ below maximum storm surge level, see Fig. 27. In a further
elaboration of the results, Vellinga (1984) shows that this profile can be
satisfactorily described by the power curve d = 0°08 yOTg°
storm surge level
T
h
~. ~rosion profile
]
/
/ °.'3 .o,
~i t,ol prome
~~~
ndword dtrec t~on
seoward h m, t y, 250 (HoslZ6) "28 (CtO26a/w) a~: h. 5.72 (HoslZ6)
h, y ond ~
in m; w in mls
Fig. 27 : Erosion profile after storm surge
After introducing the effect of wave steepness and the effect of grain size in a
semi-empirical way, a more general expression of the erosion profile in the
nearshore zone is :found :
d = 0.70 (Ho/Lo) °'17 w TM yO.78
(68)