

36
K. Myrberg and A. Lehmann
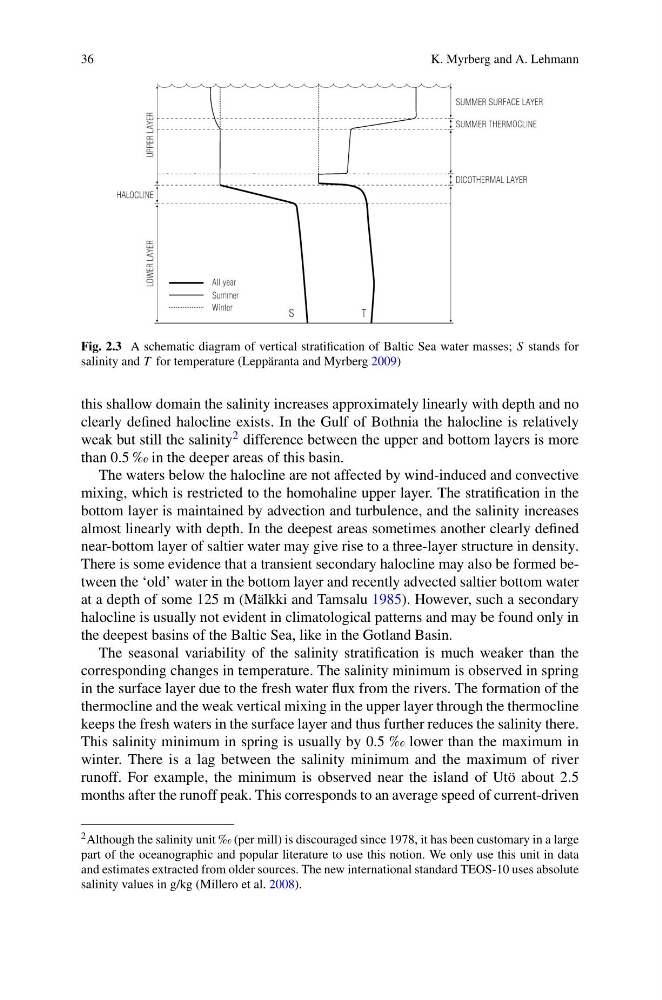
Fig. 2.3 A schematic diagram of vertical stratification of Baltic Sea water masses; S stands for
salinity and T for temperature (Leppäranta and Myrberg 2009)
this shallow domain the salinity increases approximately linearly with depth and no
clearly defined halocline exists. In the Gulf of Bothnia the halocline is relatively
weak but still the salinity 2 difference between the upper and bottom layers is more
than 0.5 ‰ in the deeper areas of this basin.
The waters below the halocline are not affected by wind-induced and convective
mixing, which is restricted to the homohaline upper layer. The stratification in the
bottom layer is maintained by advection and turbulence, and the salinity increases
almost linearly with depth. In the deepest areas sometimes another clearly defined
near-bottom layer of saltier water may give rise to a three-layer structure in density.
There is some evidence that a transient secondary halocline may also be formed between the ‘old’ water in the bottom layer and recently advected saltier bottom water
at a depth of some 125 m (Mälkki and Tamsalu 1985). However, such a secondary
halocline is usually not evident in climatological patterns and may be found only in
the deepest basins of the Baltic Sea, like in the Gotland Basin.
The seasonal variability of the salinity stratification is much weaker than the
corresponding changes in temperature. The salinity minimum is observed in spring
in the surface layer due to the fresh water flux from the rivers. The formation of the
thermocline and the weak vertical mixing in the upper layer through the thermocline
keeps the fresh waters in the surface layer and thus further reduces the salinity there.
This salinity minimum in spring is usually by 0.5 ‰ lower than the maximum in
winter. There is a lag between the salinity minimum and the maximum of river
runoff. For example, the minimum is observed near the island of Utö about 2.5
months after the runoff peak. This corresponds to an average speed of current-driven
2 Although the salinity unit ‰ (per mill) is discouraged since 1978, it has been customary in a large
part of the oceanographic and popular literature to use this notion. We only use this unit in data
and estimates extracted from older sources. The new international standard TEOS-10 uses absolute
salinity values in g/kg (Millero et al. 2008).
K. Myrberg and A. Lehmann
Fig. 2.3 A schematic diagram of vertical stratification of Baltic Sea water masses; S stands for
salinity and T for temperature (Leppäranta and Myrberg 2009)
this shallow domain the salinity increases approximately linearly with depth and no
clearly defined halocline exists. In the Gulf of Bothnia the halocline is relatively
weak but still the salinity 2 difference between the upper and bottom layers is more
than 0.5 ‰ in the deeper areas of this basin.
The waters below the halocline are not affected by wind-induced and convective
mixing, which is restricted to the homohaline upper layer. The stratification in the
bottom layer is maintained by advection and turbulence, and the salinity increases
almost linearly with depth. In the deepest areas sometimes another clearly defined
near-bottom layer of saltier water may give rise to a three-layer structure in density.
There is some evidence that a transient secondary halocline may also be formed between the ‘old’ water in the bottom layer and recently advected saltier bottom water
at a depth of some 125 m (Mälkki and Tamsalu 1985). However, such a secondary
halocline is usually not evident in climatological patterns and may be found only in
the deepest basins of the Baltic Sea, like in the Gotland Basin.
The seasonal variability of the salinity stratification is much weaker than the
corresponding changes in temperature. The salinity minimum is observed in spring
in the surface layer due to the fresh water flux from the rivers. The formation of the
thermocline and the weak vertical mixing in the upper layer through the thermocline
keeps the fresh waters in the surface layer and thus further reduces the salinity there.
This salinity minimum in spring is usually by 0.5 ‰ lower than the maximum in
winter. There is a lag between the salinity minimum and the maximum of river
runoff. For example, the minimum is observed near the island of Utö about 2.5
months after the runoff peak. This corresponds to an average speed of current-driven
2 Although the salinity unit ‰ (per mill) is discouraged since 1978, it has been customary in a large
part of the oceanographic and popular literature to use this notion. We only use this unit in data
and estimates extracted from older sources. The new international standard TEOS-10 uses absolute
salinity values in g/kg (Millero et al. 2008).