

11 Applications of an Oil Drift and Fate Model for Fairway Design
381
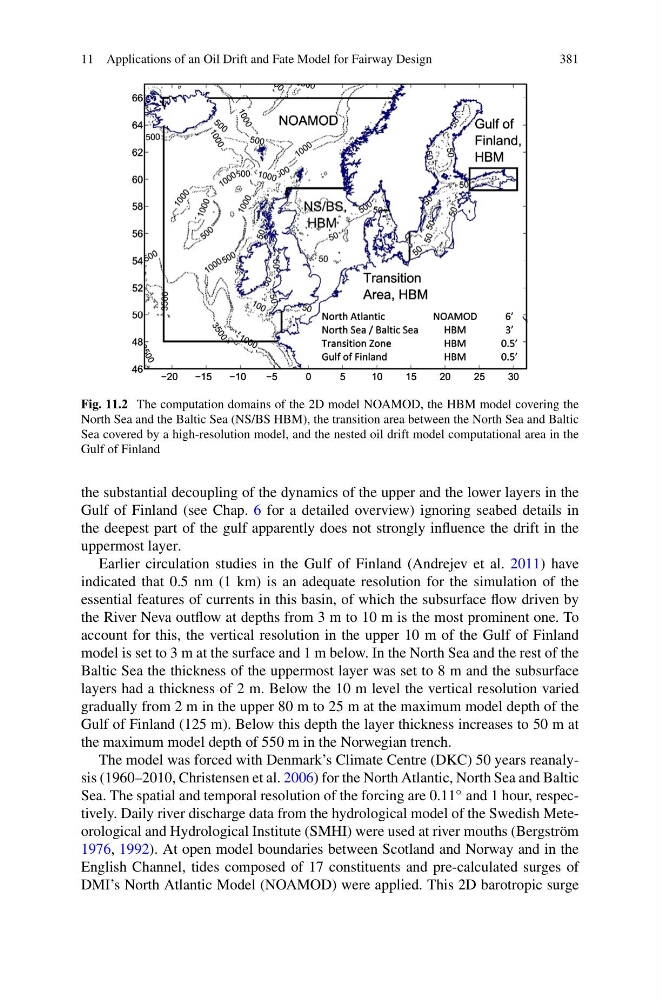
Fig. 11.2 The computation domains of the 2D model NOAMOD, the HBM model covering the
North Sea and the Baltic Sea (NS/BS HBM), the transition area between the North Sea and Baltic
Sea covered by a high-resolution model, and the nested oil drift model computational area in the
Gulf of Finland
the substantial decoupling of the dynamics of the upper and the lower layers in the
Gulf of Finland (see Chap. 6 for a detailed overview) ignoring seabed details in
the deepest part of the gulf apparently does not strongly influence the drift in the
uppermost layer.
Earlier circulation studies in the Gulf of Finland (Andrejev et al. 2011) have
indicated that 0.5 nm (1 km) is an adequate resolution for the simulation of the
essential features of currents in this basin, of which the subsurface flow driven by
the River Neva outflow at depths from 3 m to 10 m is the most prominent one. To
account for this, the vertical resolution in the upper 10 m of the Gulf of Finland
model is set to 3 m at the surface and 1 m below. In the North Sea and the rest of the
Baltic Sea the thickness of the uppermost layer was set to 8 m and the subsurface
layers had a thickness of 2 m. Below the 10 m level the vertical resolution varied
gradually from 2 m in the upper 80 m to 25 m at the maximum model depth of the
Gulf of Finland (125 m). Below this depth the layer thickness increases to 50 m at
the maximum model depth of 550 m in the Norwegian trench.
The model was forced with Denmark’s Climate Centre (DKC) 50 years reanalysis (1960–2010, Christensen et al. 2006) for the North Atlantic, North Sea and Baltic
Sea. The spatial and temporal resolution of the forcing are 0.11 ◦ and 1 hour, respectively. Daily river discharge data from the hydrological model of the Swedish Meteorological and Hydrological Institute (SMHI) were used at river mouths (Bergström
1976, 1992). At open model boundaries between Scotland and Norway and in the
English Channel, tides composed of 17 constituents and pre-calculated surges of
DMI’s North Atlantic Model (NOAMOD) were applied. This 2D barotropic surge
381
Fig. 11.2 The computation domains of the 2D model NOAMOD, the HBM model covering the
North Sea and the Baltic Sea (NS/BS HBM), the transition area between the North Sea and Baltic
Sea covered by a high-resolution model, and the nested oil drift model computational area in the
Gulf of Finland
the substantial decoupling of the dynamics of the upper and the lower layers in the
Gulf of Finland (see Chap. 6 for a detailed overview) ignoring seabed details in
the deepest part of the gulf apparently does not strongly influence the drift in the
uppermost layer.
Earlier circulation studies in the Gulf of Finland (Andrejev et al. 2011) have
indicated that 0.5 nm (1 km) is an adequate resolution for the simulation of the
essential features of currents in this basin, of which the subsurface flow driven by
the River Neva outflow at depths from 3 m to 10 m is the most prominent one. To
account for this, the vertical resolution in the upper 10 m of the Gulf of Finland
model is set to 3 m at the surface and 1 m below. In the North Sea and the rest of the
Baltic Sea the thickness of the uppermost layer was set to 8 m and the subsurface
layers had a thickness of 2 m. Below the 10 m level the vertical resolution varied
gradually from 2 m in the upper 80 m to 25 m at the maximum model depth of the
Gulf of Finland (125 m). Below this depth the layer thickness increases to 50 m at
the maximum model depth of 550 m in the Norwegian trench.
The model was forced with Denmark’s Climate Centre (DKC) 50 years reanalysis (1960–2010, Christensen et al. 2006) for the North Atlantic, North Sea and Baltic
Sea. The spatial and temporal resolution of the forcing are 0.11 ◦ and 1 hour, respectively. Daily river discharge data from the hydrological model of the Swedish Meteorological and Hydrological Institute (SMHI) were used at river mouths (Bergström
1976, 1992). At open model boundaries between Scotland and Norway and in the
English Channel, tides composed of 17 constituents and pre-calculated surges of
DMI’s North Atlantic Model (NOAMOD) were applied. This 2D barotropic surge