

10 Applications of the Inverse Problem of Pollution Propagation
357
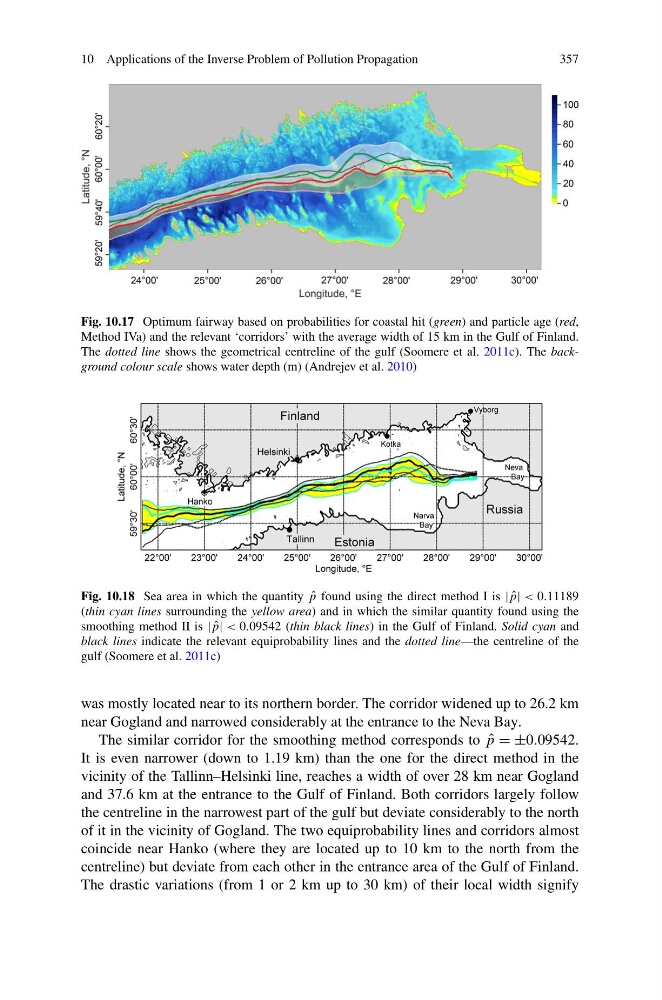
Fig. 10.17 Optimum fairway based on probabilities for coastal hit (green) and particle age (red,
Method IVa) and the relevant ‘corridors’ with the average width of 15 km in the Gulf of Finland.
The dotted line shows the geometrical centreline of the gulf (Soomere et al. 2011c). The background colour scale shows water depth (m) (Andrejev et al. 2010)
Fig. 10.18 Sea area in which the quantity ˆ
p found using the direct method I is | ˆ
p| < 0.11189
(thin cyan lines surrounding the yellow area) and in which the similar quantity found using the
smoothing method II is | ˆ
p| < 0.09542 (thin black lines) in the Gulf of Finland. Solid cyan and
black lines indicate the relevant equiprobability lines and the dotted line—the centreline of the
gulf (Soomere et al. 2011c)
was mostly located near to its northern border. The corridor widened up to 26.2 km
near Gogland and narrowed considerably at the entrance to the Neva Bay.
The similar corridor for the smoothing method corresponds to ˆ
p = ±0.09542.
It is even narrower (down to 1.19 km) than the one for the direct method in the
vicinity of the Tallinn–Helsinki line, reaches a width of over 28 km near Gogland
and 37.6 km at the entrance to the Gulf of Finland. Both corridors largely follow
the centreline in the narrowest part of the gulf but deviate considerably to the north
of it in the vicinity of Gogland. The two equiprobability lines and corridors almost
coincide near Hanko (where they are located up to 10 km to the north from the
centreline) but deviate from each other in the entrance area of the Gulf of Finland.
The drastic variations (from 1 or 2 km up to 30 km) of their local width signify
357
Fig. 10.17 Optimum fairway based on probabilities for coastal hit (green) and particle age (red,
Method IVa) and the relevant ‘corridors’ with the average width of 15 km in the Gulf of Finland.
The dotted line shows the geometrical centreline of the gulf (Soomere et al. 2011c). The background colour scale shows water depth (m) (Andrejev et al. 2010)
Fig. 10.18 Sea area in which the quantity ˆ
p found using the direct method I is | ˆ
p| < 0.11189
(thin cyan lines surrounding the yellow area) and in which the similar quantity found using the
smoothing method II is | ˆ
p| < 0.09542 (thin black lines) in the Gulf of Finland. Solid cyan and
black lines indicate the relevant equiprobability lines and the dotted line—the centreline of the
gulf (Soomere et al. 2011c)
was mostly located near to its northern border. The corridor widened up to 26.2 km
near Gogland and narrowed considerably at the entrance to the Neva Bay.
The similar corridor for the smoothing method corresponds to ˆ
p = ±0.09542.
It is even narrower (down to 1.19 km) than the one for the direct method in the
vicinity of the Tallinn–Helsinki line, reaches a width of over 28 km near Gogland
and 37.6 km at the entrance to the Gulf of Finland. Both corridors largely follow
the centreline in the narrowest part of the gulf but deviate considerably to the north
of it in the vicinity of Gogland. The two equiprobability lines and corridors almost
coincide near Hanko (where they are located up to 10 km to the north from the
centreline) but deviate from each other in the entrance area of the Gulf of Finland.
The drastic variations (from 1 or 2 km up to 30 km) of their local width signify