

10 Applications of the Inverse Problem of Pollution Propagation
341
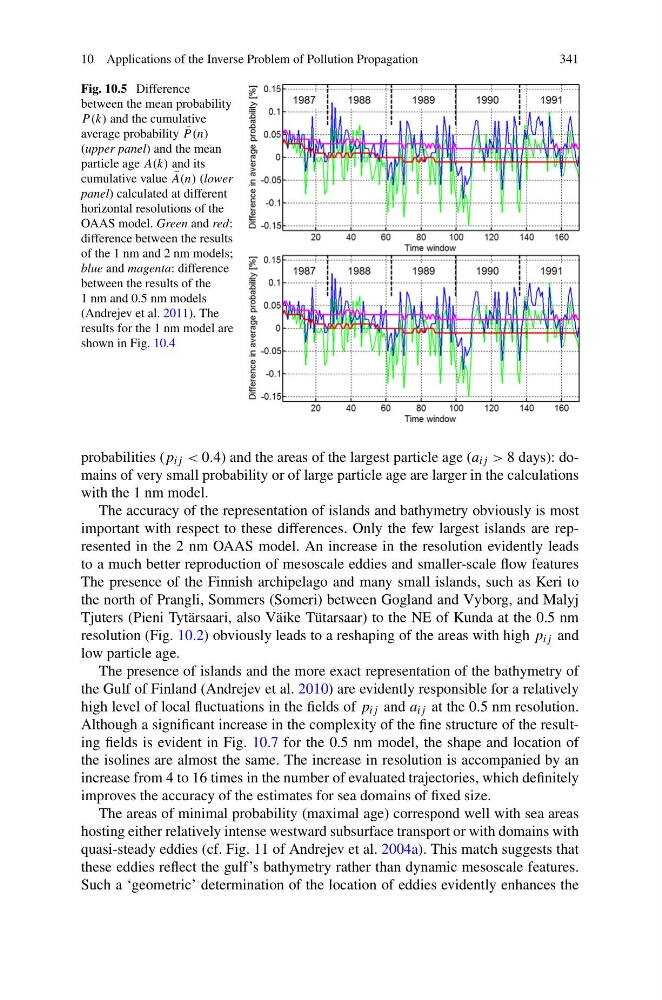
Fig. 10.5 Difference
between the mean probability
P (k) and the cumulative
average probability ¯
P (n)
(upper panel) and the mean
particle age A(k) and its
cumulative value ¯
A(n) (lower
panel) calculated at different
horizontal resolutions of the
OAAS model. Green and red:
difference between the results
of the 1 nm and 2 nm models;
blue and magenta: difference
between the results of the
1 nm and 0.5 nm models
(Andrejev et al. 2011). The
results for the 1 nm model are
shown in Fig. 10.4
probabilities (p ij < 0.4) and the areas of the largest particle age (a ij > 8 days): domains of very small probability or of large particle age are larger in the calculations
with the 1 nm model.
The accuracy of the representation of islands and bathymetry obviously is most
important with respect to these differences. Only the few largest islands are represented in the 2 nm OAAS model. An increase in the resolution evidently leads
to a much better reproduction of mesoscale eddies and smaller-scale flow features
The presence of the Finnish archipelago and many small islands, such as Keri to
the north of Prangli, Sommers (Someri) between Gogland and Vyborg, and Malyj
Tjuters (Pieni Tytärsaari, also Väike Tütarsaar) to the NE of Kunda at the 0.5 nm
resolution (Fig. 10.2) obviously leads to a reshaping of the areas with high p ij and
low particle age.
The presence of islands and the more exact representation of the bathymetry of
the Gulf of Finland (Andrejev et al. 2010) are evidently responsible for a relatively
high level of local fluctuations in the fields of p ij and a ij at the 0.5 nm resolution.
Although a significant increase in the complexity of the fine structure of the resulting fields is evident in Fig. 10.7 for the 0.5 nm model, the shape and location of
the isolines are almost the same. The increase in resolution is accompanied by an
increase from 4 to 16 times in the number of evaluated trajectories, which definitely
improves the accuracy of the estimates for sea domains of fixed size.
The areas of minimal probability (maximal age) correspond well with sea areas
hosting either relatively intense westward subsurface transport or with domains with
quasi-steady eddies (cf. Fig. 11 of Andrejev et al. 2004a). This match suggests that
these eddies reflect the gulf’s bathymetry rather than dynamic mesoscale features.
Such a ‘geometric’ determination of the location of eddies evidently enhances the
341
Fig. 10.5 Difference
between the mean probability
P (k) and the cumulative
average probability ¯
P (n)
(upper panel) and the mean
particle age A(k) and its
cumulative value ¯
A(n) (lower
panel) calculated at different
horizontal resolutions of the
OAAS model. Green and red:
difference between the results
of the 1 nm and 2 nm models;
blue and magenta: difference
between the results of the
1 nm and 0.5 nm models
(Andrejev et al. 2011). The
results for the 1 nm model are
shown in Fig. 10.4
probabilities (p ij < 0.4) and the areas of the largest particle age (a ij > 8 days): domains of very small probability or of large particle age are larger in the calculations
with the 1 nm model.
The accuracy of the representation of islands and bathymetry obviously is most
important with respect to these differences. Only the few largest islands are represented in the 2 nm OAAS model. An increase in the resolution evidently leads
to a much better reproduction of mesoscale eddies and smaller-scale flow features
The presence of the Finnish archipelago and many small islands, such as Keri to
the north of Prangli, Sommers (Someri) between Gogland and Vyborg, and Malyj
Tjuters (Pieni Tytärsaari, also Väike Tütarsaar) to the NE of Kunda at the 0.5 nm
resolution (Fig. 10.2) obviously leads to a reshaping of the areas with high p ij and
low particle age.
The presence of islands and the more exact representation of the bathymetry of
the Gulf of Finland (Andrejev et al. 2010) are evidently responsible for a relatively
high level of local fluctuations in the fields of p ij and a ij at the 0.5 nm resolution.
Although a significant increase in the complexity of the fine structure of the resulting fields is evident in Fig. 10.7 for the 0.5 nm model, the shape and location of
the isolines are almost the same. The increase in resolution is accompanied by an
increase from 4 to 16 times in the number of evaluated trajectories, which definitely
improves the accuracy of the estimates for sea domains of fixed size.
The areas of minimal probability (maximal age) correspond well with sea areas
hosting either relatively intense westward subsurface transport or with domains with
quasi-steady eddies (cf. Fig. 11 of Andrejev et al. 2004a). This match suggests that
these eddies reflect the gulf’s bathymetry rather than dynamic mesoscale features.
Such a ‘geometric’ determination of the location of eddies evidently enhances the