

8 Trajectories and Spreading of Observed and Simulated Drifters in the Baltic Sea
259
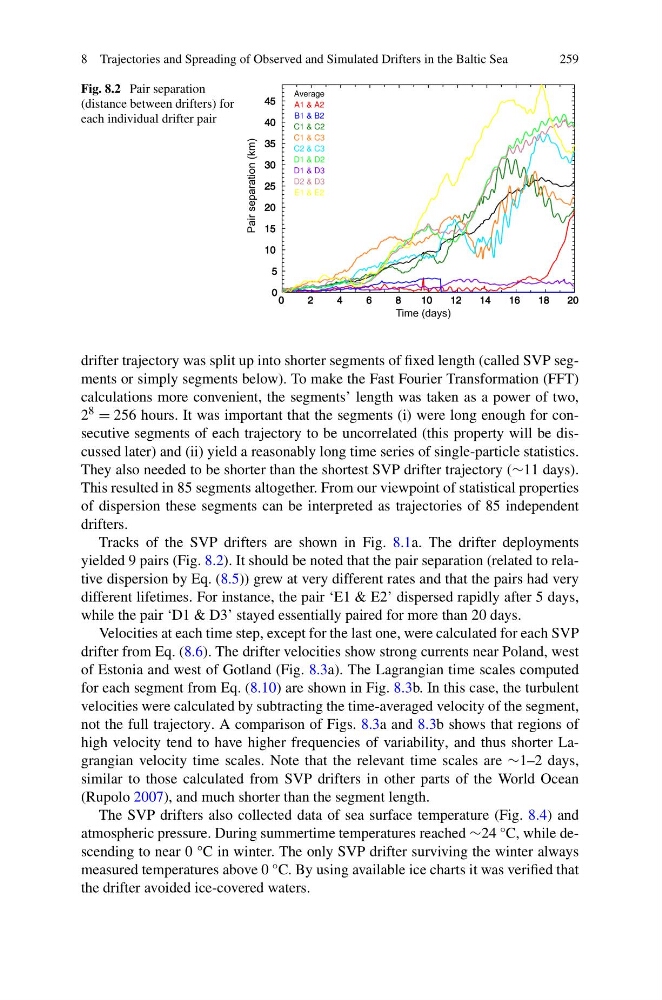
Fig. 8.2 Pair separation
(distance between drifters) for
each individual drifter pair
drifter trajectory was split up into shorter segments of fixed length (called SVP segments or simply segments below). To make the Fast Fourier Transformation (FFT)
calculations more convenient, the segments’ length was taken as a power of two,
2 8 = 256 hours. It was important that the segments (i) were long enough for consecutive segments of each trajectory to be uncorrelated (this property will be discussed later) and (ii) yield a reasonably long time series of single-particle statistics.
They also needed to be shorter than the shortest SVP drifter trajectory (∼11 days).
This resulted in 85 segments altogether. From our viewpoint of statistical properties
of dispersion these segments can be interpreted as trajectories of 85 independent
drifters.
Tracks of the SVP drifters are shown in Fig. 8.1a. The drifter deployments
yielded 9 pairs (Fig. 8.2). It should be noted that the pair separation (related to relative dispersion by Eq. (8.5)) grew at very different rates and that the pairs had very
different lifetimes. For instance, the pair ‘E1 & E2’ dispersed rapidly after 5 days,
while the pair ‘D1 & D3’ stayed essentially paired for more than 20 days.
Velocities at each time step, except for the last one, were calculated for each SVP
drifter from Eq. (8.6). The drifter velocities show strong currents near Poland, west
of Estonia and west of Gotland (Fig. 8.3a). The Lagrangian time scales computed
for each segment from Eq. (8.10) are shown in Fig. 8.3b. In this case, the turbulent
velocities were calculated by subtracting the time-averaged velocity of the segment,
not the full trajectory. A comparison of Figs. 8.3a and 8.3b shows that regions of
high velocity tend to have higher frequencies of variability, and thus shorter Lagrangian velocity time scales. Note that the relevant time scales are ∼1–2 days,
similar to those calculated from SVP drifters in other parts of the World Ocean
(Rupolo 2007), and much shorter than the segment length.
The SVP drifters also collected data of sea surface temperature (Fig. 8.4) and
atmospheric pressure. During summertime temperatures reached ∼24 °C, while descending to near 0 °C in winter. The only SVP drifter surviving the winter always
measured temperatures above 0 °C. By using available ice charts it was verified that
the drifter avoided ice-covered waters.
259
Fig. 8.2 Pair separation
(distance between drifters) for
each individual drifter pair
drifter trajectory was split up into shorter segments of fixed length (called SVP segments or simply segments below). To make the Fast Fourier Transformation (FFT)
calculations more convenient, the segments’ length was taken as a power of two,
2 8 = 256 hours. It was important that the segments (i) were long enough for consecutive segments of each trajectory to be uncorrelated (this property will be discussed later) and (ii) yield a reasonably long time series of single-particle statistics.
They also needed to be shorter than the shortest SVP drifter trajectory (∼11 days).
This resulted in 85 segments altogether. From our viewpoint of statistical properties
of dispersion these segments can be interpreted as trajectories of 85 independent
drifters.
Tracks of the SVP drifters are shown in Fig. 8.1a. The drifter deployments
yielded 9 pairs (Fig. 8.2). It should be noted that the pair separation (related to relative dispersion by Eq. (8.5)) grew at very different rates and that the pairs had very
different lifetimes. For instance, the pair ‘E1 & E2’ dispersed rapidly after 5 days,
while the pair ‘D1 & D3’ stayed essentially paired for more than 20 days.
Velocities at each time step, except for the last one, were calculated for each SVP
drifter from Eq. (8.6). The drifter velocities show strong currents near Poland, west
of Estonia and west of Gotland (Fig. 8.3a). The Lagrangian time scales computed
for each segment from Eq. (8.10) are shown in Fig. 8.3b. In this case, the turbulent
velocities were calculated by subtracting the time-averaged velocity of the segment,
not the full trajectory. A comparison of Figs. 8.3a and 8.3b shows that regions of
high velocity tend to have higher frequencies of variability, and thus shorter Lagrangian velocity time scales. Note that the relevant time scales are ∼1–2 days,
similar to those calculated from SVP drifters in other parts of the World Ocean
(Rupolo 2007), and much shorter than the segment length.
The SVP drifters also collected data of sea surface temperature (Fig. 8.4) and
atmospheric pressure. During summertime temperatures reached ∼24 °C, while descending to near 0 °C in winter. The only SVP drifter surviving the winter always
measured temperatures above 0 °C. By using available ice charts it was verified that
the drifter avoided ice-covered waters.