

170
E.V. Stanev and X. Lu
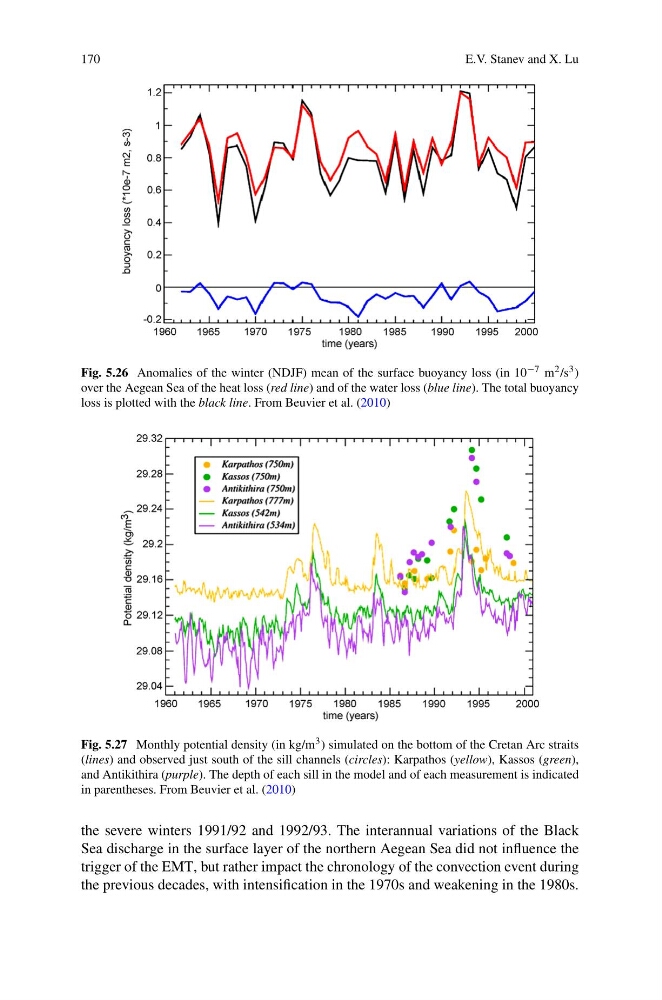
Fig. 5.26 Anomalies of the winter (NDJF) mean of the surface buoyancy loss (in 10 −7 m 2 /s 3 )
over the Aegean Sea of the heat loss (red line) and of the water loss (blue line). The total buoyancy
loss is plotted with the black line. From Beuvier et al. (2010)
Fig. 5.27 Monthly potential density (in kg/m 3 ) simulated on the bottom of the Cretan Arc straits
(lines) and observed just south of the sill channels (circles): Karpathos (yellow), Kassos (green),
and Antikithira (purple). The depth of each sill in the model and of each measurement is indicated
in parentheses. From Beuvier et al. (2010)
the severe winters 1991/92 and 1992/93. The interannual variations of the Black
Sea discharge in the surface layer of the northern Aegean Sea did not influence the
trigger of the EMT, but rather impact the chronology of the convection event during
the previous decades, with intensification in the 1970s and weakening in the 1980s.
E.V. Stanev and X. Lu
Fig. 5.26 Anomalies of the winter (NDJF) mean of the surface buoyancy loss (in 10 −7 m 2 /s 3 )
over the Aegean Sea of the heat loss (red line) and of the water loss (blue line). The total buoyancy
loss is plotted with the black line. From Beuvier et al. (2010)
Fig. 5.27 Monthly potential density (in kg/m 3 ) simulated on the bottom of the Cretan Arc straits
(lines) and observed just south of the sill channels (circles): Karpathos (yellow), Kassos (green),
and Antikithira (purple). The depth of each sill in the model and of each measurement is indicated
in parentheses. From Beuvier et al. (2010)
the severe winters 1991/92 and 1992/93. The interannual variations of the Black
Sea discharge in the surface layer of the northern Aegean Sea did not influence the
trigger of the EMT, but rather impact the chronology of the convection event during
the previous decades, with intensification in the 1970s and weakening in the 1980s.