

332
K. Takao . B. T. Bower
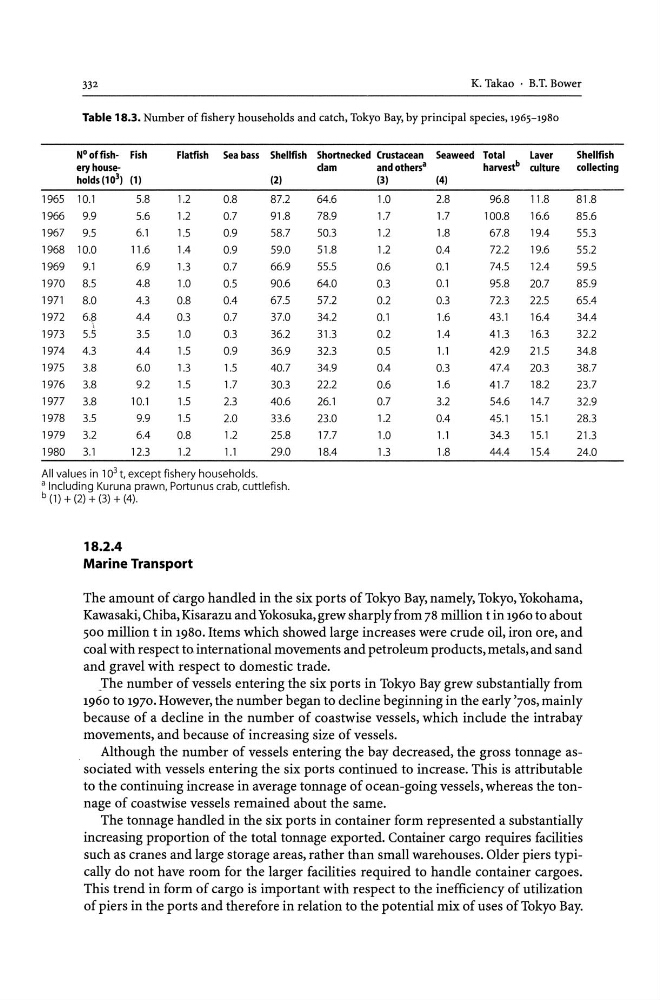
Table 18.3. Number of fishery households and catch, Tokyo Bay, by principal species, 1965-1980
N° offish- Fish
Flatfish Sea bass Shellfish Shortnecked Crustacean Seaweed Total
laver
Shellfish
eryhousedam
andothers a
harve~ culture collecting
holds (103) (1)
(2)
(3)
(4)
1965 10.1
5.8
1.2
0.8
87.2
64.6
1.0
2.8
96.8
11.8
81.8
1966
9.9
5.6
1.2
0.7
91.8
78.9
1.7
1.7
100.8
16.6
85.6
1967
9.5
6.1
1.5
0.9
58.7
50.3
1.2
1.8
67.8
19.4
55.3
1968 10.0
11.6
1.4
0.9
59.0
51.8
1.2
0.4
72.2
19.6
55.2
1969
9.1
6.9
1.3
0.7
66.9
55.5
0.6
0.1
74.5
12.4
59.5
1970
8.5
4.8
1.0
0.5
90.6
64.0
0.3
0.1
95.8
20.7
85.9
1971
8.0
4.3
0.8
0.4
67.5
57.2
0.2
0.3
72.3
22.5
65.4
1972
6.S
4.4
0.3
0.7
37.0
34.2
0.1
1.6
43.1
16.4
34.4
1973
5.~
3.5
1.0
0.3
36.2
31.3
0.2
1.4
41.3
16.3
32.2
1974
4.3
4.4
1.5
0.9
36.9
32.3
0.5
1.1
42.9
21.5
34.8
1975
3.8
6.0
1.3
1.5
40.7
34.9
0.4
0.3
47.4
20.3
38.7
1976
3.8
9.2
1.5
1.7
30.3
22.2
0.6
1.6
41.7
18.2
23.7
1977
3.8
10.1
1.5
2.3
40.6
26.1
0.7
3.2
54.6
14.7
32.9
1978
3.5
9.9
1.5
2.0
33.6
23.0
1.2
0.4
45.1
15.1
28.3
1979
3.2
6.4
0.8
1.2
25.8
17.7
1.0
1.1
34.3
15.1
21.3
1980
3.1
12.3
1.2
1.1
29.0
18.4
1.3
1.8
44.4
15.4
24.0
All values in 10 3 t, except fishery households.
a Including Kuruna prawn, Portunus crab, cuttlefish.
b (1) + (2) + (3) + (4).
18.2.4
Marine Transport
The amount of cargo handled in the six ports of Tokyo Bay, namely, Tokyo, Yokohama,
Kawasaki, Chiba, Kisarazu and Yokosuka, grew sharply from 78 million tin 1960 to about
500 million t in 1980. Items which showed large increases were crude oil, iron ore, and
coal with respect to international movements and petroleum products, metals, and sand
and gravel with respect to domestic trade.
Jhe number of vessels entering the six ports in Tokyo Bay grew substantially from
1960 to 1970. However, the number began to decline beginning in the early '70S, mainly
because of a decline in the number of coastwise vessels, which include the intrabay
movements, and because of increasing size of vessels.
Although the number of vessels entering the bay decreased, the gross tonnage associated with vessels entering the six ports continued to increase. This is attributable
to the continuing increase in average tonnage of ocean-going vessels, whereas the tonnage of coastwise vessels remained about the same.
The tonnage handled in the six potts in container form represented a substantially
increasing proportion of the total tonnage exported. Container cargo requires facilities
such as cranes and large storage areas, rather than small warehouses. Older piers typically do not have room for the larger facilities required to handle container cargoes.
This trend in form of cargo is important with respect to the inefficiency of utilization
of piers in the ports and therefore in relation to the potential mix of uses of Tokyo Bay.
K. Takao . B. T. Bower
Table 18.3. Number of fishery households and catch, Tokyo Bay, by principal species, 1965-1980
N° offish- Fish
Flatfish Sea bass Shellfish Shortnecked Crustacean Seaweed Total
laver
Shellfish
eryhousedam
andothers a
harve~ culture collecting
holds (103) (1)
(2)
(3)
(4)
1965 10.1
5.8
1.2
0.8
87.2
64.6
1.0
2.8
96.8
11.8
81.8
1966
9.9
5.6
1.2
0.7
91.8
78.9
1.7
1.7
100.8
16.6
85.6
1967
9.5
6.1
1.5
0.9
58.7
50.3
1.2
1.8
67.8
19.4
55.3
1968 10.0
11.6
1.4
0.9
59.0
51.8
1.2
0.4
72.2
19.6
55.2
1969
9.1
6.9
1.3
0.7
66.9
55.5
0.6
0.1
74.5
12.4
59.5
1970
8.5
4.8
1.0
0.5
90.6
64.0
0.3
0.1
95.8
20.7
85.9
1971
8.0
4.3
0.8
0.4
67.5
57.2
0.2
0.3
72.3
22.5
65.4
1972
6.S
4.4
0.3
0.7
37.0
34.2
0.1
1.6
43.1
16.4
34.4
1973
5.~
3.5
1.0
0.3
36.2
31.3
0.2
1.4
41.3
16.3
32.2
1974
4.3
4.4
1.5
0.9
36.9
32.3
0.5
1.1
42.9
21.5
34.8
1975
3.8
6.0
1.3
1.5
40.7
34.9
0.4
0.3
47.4
20.3
38.7
1976
3.8
9.2
1.5
1.7
30.3
22.2
0.6
1.6
41.7
18.2
23.7
1977
3.8
10.1
1.5
2.3
40.6
26.1
0.7
3.2
54.6
14.7
32.9
1978
3.5
9.9
1.5
2.0
33.6
23.0
1.2
0.4
45.1
15.1
28.3
1979
3.2
6.4
0.8
1.2
25.8
17.7
1.0
1.1
34.3
15.1
21.3
1980
3.1
12.3
1.2
1.1
29.0
18.4
1.3
1.8
44.4
15.4
24.0
All values in 10 3 t, except fishery households.
a Including Kuruna prawn, Portunus crab, cuttlefish.
b (1) + (2) + (3) + (4).
18.2.4
Marine Transport
The amount of cargo handled in the six ports of Tokyo Bay, namely, Tokyo, Yokohama,
Kawasaki, Chiba, Kisarazu and Yokosuka, grew sharply from 78 million tin 1960 to about
500 million t in 1980. Items which showed large increases were crude oil, iron ore, and
coal with respect to international movements and petroleum products, metals, and sand
and gravel with respect to domestic trade.
Jhe number of vessels entering the six ports in Tokyo Bay grew substantially from
1960 to 1970. However, the number began to decline beginning in the early '70S, mainly
because of a decline in the number of coastwise vessels, which include the intrabay
movements, and because of increasing size of vessels.
Although the number of vessels entering the bay decreased, the gross tonnage associated with vessels entering the six ports continued to increase. This is attributable
to the continuing increase in average tonnage of ocean-going vessels, whereas the tonnage of coastwise vessels remained about the same.
The tonnage handled in the six potts in container form represented a substantially
increasing proportion of the total tonnage exported. Container cargo requires facilities
such as cranes and large storage areas, rather than small warehouses. Older piers typically do not have room for the larger facilities required to handle container cargoes.
This trend in form of cargo is important with respect to the inefficiency of utilization
of piers in the ports and therefore in relation to the potential mix of uses of Tokyo Bay.