

CHAPTER 17 • Sustainable Developmental Planning in Ecologically Sensitive Dahanu Region
315
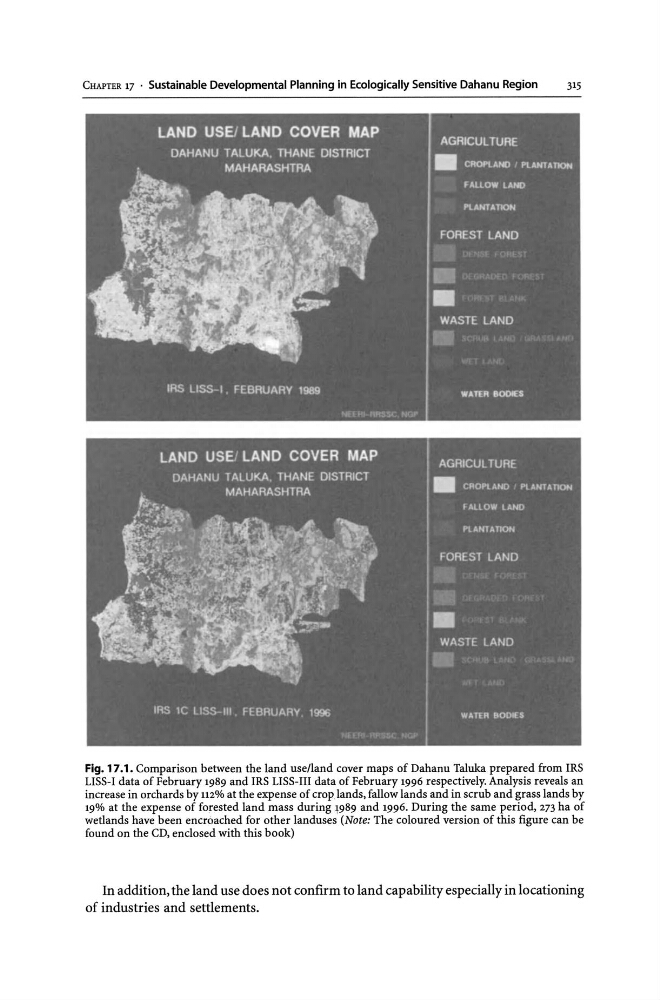
Fig. 17.1. Comparison between the land use/land cover maps of Dahanu Taluka prepared from IRS
LISS-I data of February 1989 and IRS LISS-III data of February 1996 respectively. Analysis reveals an
increase in orchards by 112% at the expense of croplands, fallow lands and in scrub and grass lands by
19% at the expense of forested land mass during W89 and 1996. During the same period, 273 ha of
wetlands have been encroached for other landuses (Note: The coloured version of this figure can be
found on the CD, enclosed with this book)
In addition, the land use does not confirm to land capability especially in locationing
of industries and settlements.
315
Fig. 17.1. Comparison between the land use/land cover maps of Dahanu Taluka prepared from IRS
LISS-I data of February 1989 and IRS LISS-III data of February 1996 respectively. Analysis reveals an
increase in orchards by 112% at the expense of croplands, fallow lands and in scrub and grass lands by
19% at the expense of forested land mass during W89 and 1996. During the same period, 273 ha of
wetlands have been encroached for other landuses (Note: The coloured version of this figure can be
found on the CD, enclosed with this book)
In addition, the land use does not confirm to land capability especially in locationing
of industries and settlements.