

102
A.J. Underwood . M.G. Chapman
Predator
Sponge
18
P,edator
A B C
0
kcall00m ' Y
r
' ' _ _ 1_7_-f'c::.:::::::~~9 ;;;90 ;2;~:::5 :::~~~~S4 ~~~
Sponge
4
6
8
14
15
16
17
18
CCl"oIer (' 1&)
1.2 1.1 1.1
0.8
0.02 0.02 0.01 0.01 O.oJ
Predator
A
C
o
Sponge
4
8
9
10
11 12 13
14
15 16
17
18
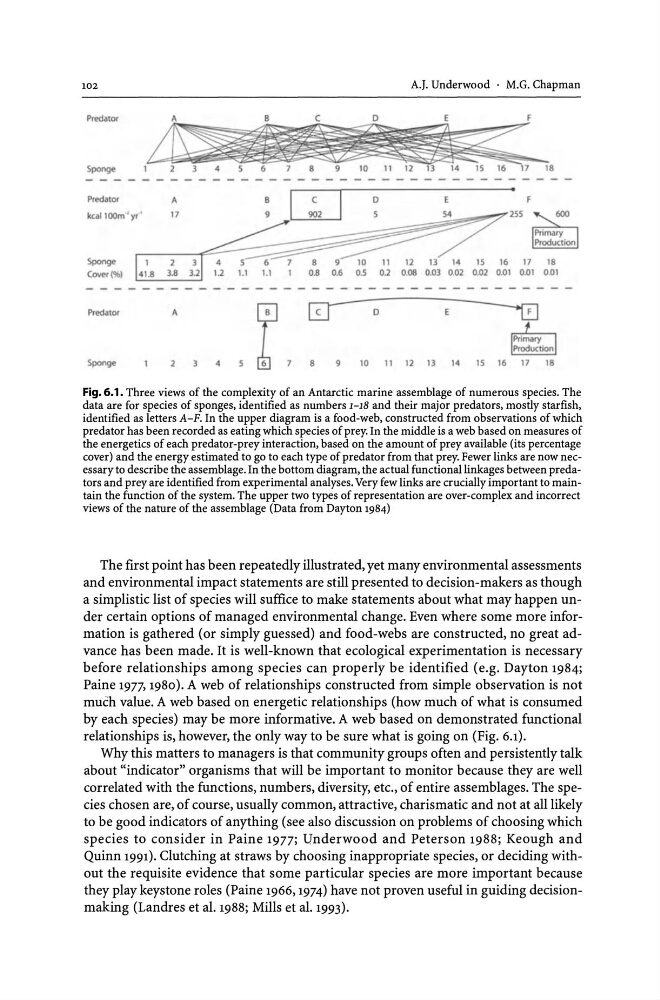
Fig. 6.1. Three views of the complexity of an Antarctic marine assemblage of numerous species. The
data are for species of sponges, identified as numbers 1-18 and their major predators, mostly starfish,
identified as letters A-F. In the upper diagram is a food-web, constructed from observations of which
predator has been recorded as eating which species of prey. In the middle is a web based on measures of
the energetics of each predator-prey interaction, based on the amount of prey available (its percentage
cover) and the energy estimated to go to each type of predator from that prey. Fewer links are now necessary to describe the assemblage. In the bottom diagram, the actual functional linkages between predators and prey are identified from experimental analyses. Very few links are crucially important to maintain the function of the system. The upper two types of representation are over-complex and incorrect
views of the nature of the assemblage (Data from Dayton 1984)
The first point has been repeatedly illustrated, yet many environmental assessments
and environmental impact statements are still presented to decision-makers as though
a simplistic list of species will suffice to make statements about what may happen under certain options of managed environmental change. Even where some more information is gathered (or simply guessed) and food-webs are constructed, no great advance has been made. It is well-known that ecological experimentation is necessary
before relationships among species can properly be identified (e.g. Dayton 1984;
Paine 1977> 1980). A web of relationships constructed from simple observation is not
much value. A web based on energetic relationships (how much of what is consumed
by each species) may be more informative. A web based on demonstrated functional
relationships is, however, the only way to be sure what is going on (Fig. 6.1).
Why this matters to managers is that community groups often and persistently talk
about "indicator" organisms that will be important to monitor because they are well
correlated with the functions, numbers, diversity, etc., of entire assemblages. The species chosen are, of course, usually common, attractive, charismatic and not at all likely
to be good indicators of anything (see also discussion on problems of choosing which
species to consider in Paine 1977; Underwood and Peterson 1988; Keough and
Quinn 1991). Clutching at straws by choosing inappropriate species, or deciding without the requisite evidence that some particular species are more important because
they play keystone roles (Paine 1966, 1974) have not proven useful in guiding decisionmaking (Landres et al. 1988; Mills et al. 1993).
A.J. Underwood . M.G. Chapman
Predator
Sponge
18
P,edator
A B C
0
kcall00m ' Y
r
' ' _ _ 1_7_-f'c::.:::::::~~9 ;;;90 ;2;~:::5 :::~~~~S4 ~~~
Sponge
4
6
8
14
15
16
17
18
CCl"oIer (' 1&)
1.2 1.1 1.1
0.8
0.02 0.02 0.01 0.01 O.oJ
Predator
A
C
o
Sponge
4
8
9
10
11 12 13
14
15 16
17
18
Fig. 6.1. Three views of the complexity of an Antarctic marine assemblage of numerous species. The
data are for species of sponges, identified as numbers 1-18 and their major predators, mostly starfish,
identified as letters A-F. In the upper diagram is a food-web, constructed from observations of which
predator has been recorded as eating which species of prey. In the middle is a web based on measures of
the energetics of each predator-prey interaction, based on the amount of prey available (its percentage
cover) and the energy estimated to go to each type of predator from that prey. Fewer links are now necessary to describe the assemblage. In the bottom diagram, the actual functional linkages between predators and prey are identified from experimental analyses. Very few links are crucially important to maintain the function of the system. The upper two types of representation are over-complex and incorrect
views of the nature of the assemblage (Data from Dayton 1984)
The first point has been repeatedly illustrated, yet many environmental assessments
and environmental impact statements are still presented to decision-makers as though
a simplistic list of species will suffice to make statements about what may happen under certain options of managed environmental change. Even where some more information is gathered (or simply guessed) and food-webs are constructed, no great advance has been made. It is well-known that ecological experimentation is necessary
before relationships among species can properly be identified (e.g. Dayton 1984;
Paine 1977> 1980). A web of relationships constructed from simple observation is not
much value. A web based on energetic relationships (how much of what is consumed
by each species) may be more informative. A web based on demonstrated functional
relationships is, however, the only way to be sure what is going on (Fig. 6.1).
Why this matters to managers is that community groups often and persistently talk
about "indicator" organisms that will be important to monitor because they are well
correlated with the functions, numbers, diversity, etc., of entire assemblages. The species chosen are, of course, usually common, attractive, charismatic and not at all likely
to be good indicators of anything (see also discussion on problems of choosing which
species to consider in Paine 1977; Underwood and Peterson 1988; Keough and
Quinn 1991). Clutching at straws by choosing inappropriate species, or deciding without the requisite evidence that some particular species are more important because
they play keystone roles (Paine 1966, 1974) have not proven useful in guiding decisionmaking (Landres et al. 1988; Mills et al. 1993).