

In order to calculate the eigenvalues that allowed us to prioritize (weight) and
the eigenvectors used to determine the consistency index of each evaluated matrix,
we used the formula B à w ¼ k à w where B is the reciprocal matrix of pairwise
comparisons, k is the maximum eigenvalue of B, and w is the eigenvector
corresponding to k.
Table 19.1 Scale used in the pairwise comparison by the expert panel
Intensity of
importance
Definition Explanation
1
Equal
Both evaluated elements contribute equally to the objective
2
Moderate The experience and judgment slightly favor one of the elements
over the other
3
Strong
The experience and judgment strongly favor one of the elements
over the other
4
Very
strong
The evaluated variable is strongly favored and its dominance can
be demonstrated in practice
The scale was modified from that recommended by Saaty (1980)
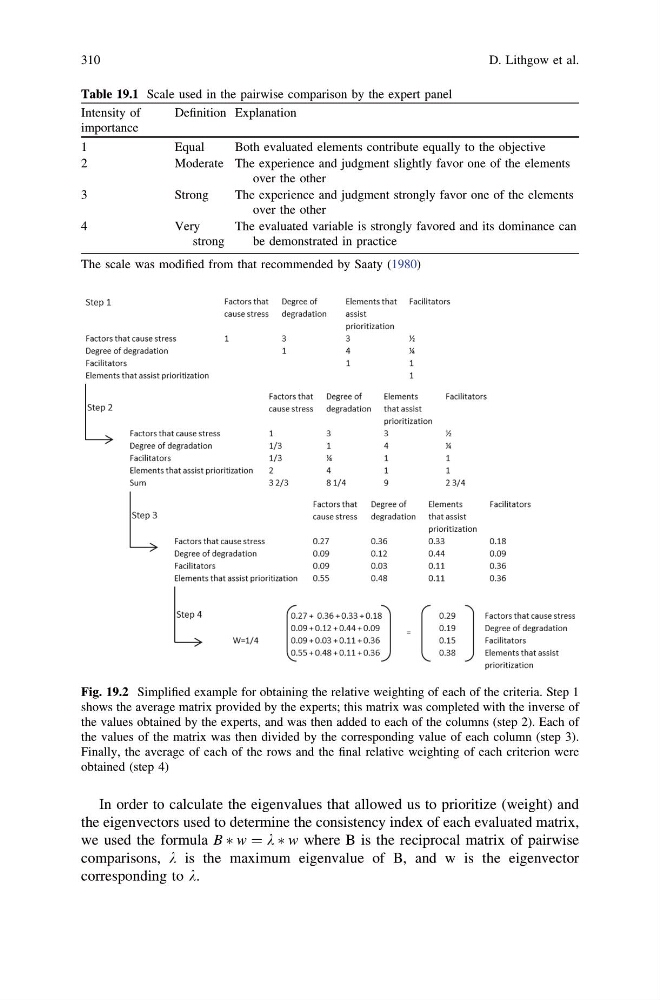
Fig. 19.2 Simplified example for obtaining the relative weighting of each of the criteria. Step 1
shows the average matrix provided by the experts; this matrix was completed with the inverse of
the values obtained by the experts, and was then added to each of the columns (step 2). Each of
the values of the matrix was then divided by the corresponding value of each column (step 3).
Finally, the average of each of the rows and the final relative weighting of each criterion were
obtained (step 4)
310
D. Lithgow et al.
the eigenvectors used to determine the consistency index of each evaluated matrix,
we used the formula B à w ¼ k à w where B is the reciprocal matrix of pairwise
comparisons, k is the maximum eigenvalue of B, and w is the eigenvector
corresponding to k.
Table 19.1 Scale used in the pairwise comparison by the expert panel
Intensity of
importance
Definition Explanation
1
Equal
Both evaluated elements contribute equally to the objective
2
Moderate The experience and judgment slightly favor one of the elements
over the other
3
Strong
The experience and judgment strongly favor one of the elements
over the other
4
Very
strong
The evaluated variable is strongly favored and its dominance can
be demonstrated in practice
The scale was modified from that recommended by Saaty (1980)
Fig. 19.2 Simplified example for obtaining the relative weighting of each of the criteria. Step 1
shows the average matrix provided by the experts; this matrix was completed with the inverse of
the values obtained by the experts, and was then added to each of the columns (step 2). Each of
the values of the matrix was then divided by the corresponding value of each column (step 3).
Finally, the average of each of the rows and the final relative weighting of each criterion were
obtained (step 4)
310
D. Lithgow et al.