

The more abundant plant species in deep-water areas were the emergent cattail,
with the presence of the free-floating common duckweed (Lemna minor), giant
duckweed (Spirodela polyrhiza), water lettuce (Pistia stratiotes), and giant
salvinia (Salvinia molesta).
16.3.3 Plant Composition and Microhabitat
Figure 16.5a shows a principal component analysis (PCA) ordination that was
performed to represent the abiotic microhabitat variables related to the plant
composition. The abiotic factors with major correlation values with the ordination
solution were water level (r = -0.67) and redox potential (Eh; r = 0.64).
The control plots dominated by Echinochloa and the Dalbergia-dominated plots
are located toward the drier areas of the restoration site. Water level is highest in
Typha-dominated areas. Figure 16.5b shows the same ordination with points
connected, with vectors indicating the direction in which each quadrat ‘‘moves’’
from time 0 to time 36. The original Dalbergia-dominated plots (top right) moved
to an area dominated by Pontederia (bottom right). The Typha and Echinochloa
(top right) and the Echinochloa-dominated plots changed to an area dominated by
Typha (center left). The control area dominated by native wetland species
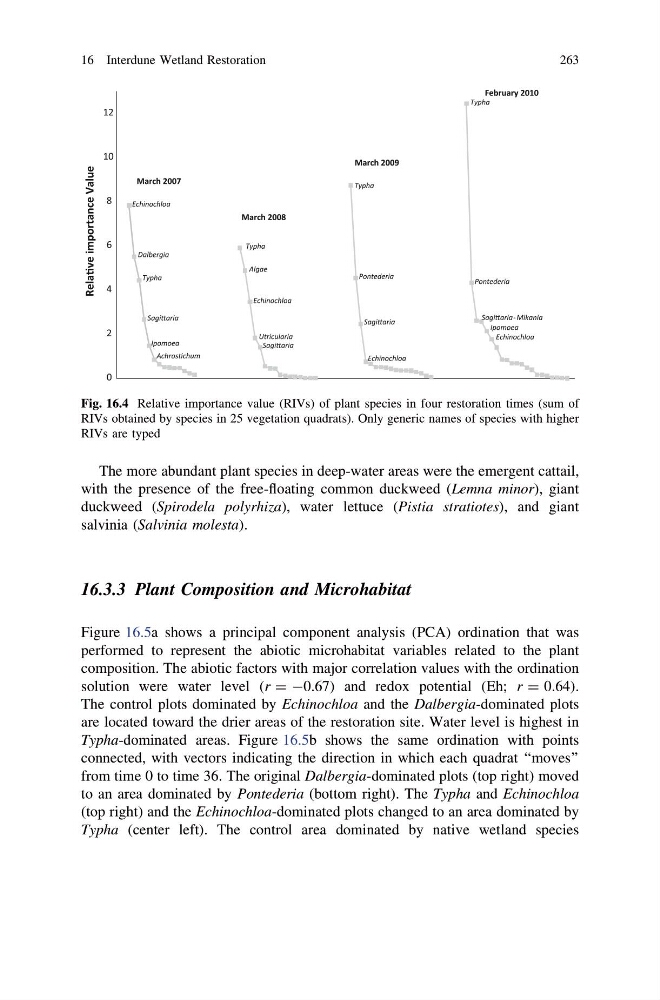
Fig. 16.4 Relative importance value (RIVs) of plant species in four restoration times (sum of
RIVs obtained by species in 25 vegetation quadrats). Only generic names of species with higher
RIVs are typed
16 Interdune Wetland Restoration
263
with the presence of the free-floating common duckweed (Lemna minor), giant
duckweed (Spirodela polyrhiza), water lettuce (Pistia stratiotes), and giant
salvinia (Salvinia molesta).
16.3.3 Plant Composition and Microhabitat
Figure 16.5a shows a principal component analysis (PCA) ordination that was
performed to represent the abiotic microhabitat variables related to the plant
composition. The abiotic factors with major correlation values with the ordination
solution were water level (r = -0.67) and redox potential (Eh; r = 0.64).
The control plots dominated by Echinochloa and the Dalbergia-dominated plots
are located toward the drier areas of the restoration site. Water level is highest in
Typha-dominated areas. Figure 16.5b shows the same ordination with points
connected, with vectors indicating the direction in which each quadrat ‘‘moves’’
from time 0 to time 36. The original Dalbergia-dominated plots (top right) moved
to an area dominated by Pontederia (bottom right). The Typha and Echinochloa
(top right) and the Echinochloa-dominated plots changed to an area dominated by
Typha (center left). The control area dominated by native wetland species
Fig. 16.4 Relative importance value (RIVs) of plant species in four restoration times (sum of
RIVs obtained by species in 25 vegetation quadrats). Only generic names of species with higher
RIVs are typed
16 Interdune Wetland Restoration
263