

15.3 Results of Restoration
15.3.1 Effect of Grazing on Dry Dune Vegetation
As indicated before, dry dune zones may differ in productivity, depending on the
availability of N and P (Kooijman et al. 1998; Kooijman and Hedenäs 2009;
Kooijman and Besse 2002). It is therefore not surprising that the effect of grazing
also depends on the productivity and nutrient limitations of the vegetation (Ten
Harkel and van der Meulen 1996).
In the foredunes along the Holland coast, grazing has a large and positive effect
on the percentage of open vegetation. The soil is calcareous, the pH is high and the
percentage of organic material is low. The availability of P is restricted by storage
in insoluble calcium phosphates, and the availability of N is relatively low because
of the high microbial demand and storage in the soil in stable organic matter.
Consequently, the productivity is also low and grazing has a relatively large impact
on the vegetation cover. The middle dunes along the Holland coast, however, are
highly productive and dominated by tall grasses and shrubs. The soils are partly
decalcified soils with pH values around 5, and all calcium phosphates have dissolved. Under such conditions, the productivity of the vegetation is barely restricted
by grazing (Table 15.2). In the oldest dunes in the hinterland of the Holland dunes,
and also in most of the dry dunes of the Wadden Sea islands, grazing has a marked
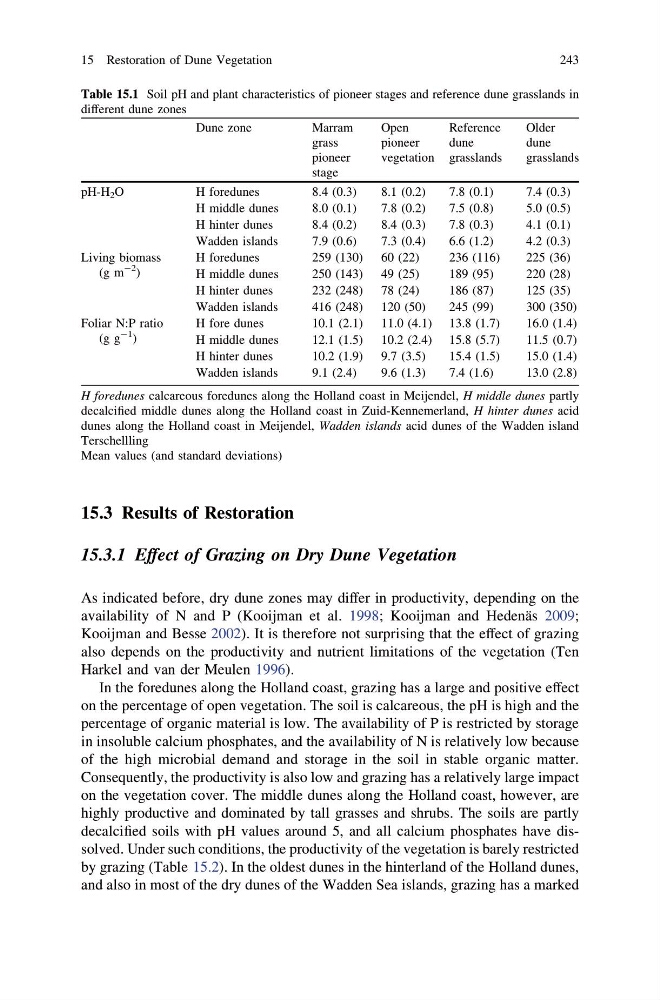
Table 15.1 Soil pH and plant characteristics of pioneer stages and reference dune grasslands in
different dune zones
Dune zone
Marram
grass
pioneer
stage
Open
pioneer
vegetation
Reference
dune
grasslands
Older
dune
grasslands
pH-H 2 O
H foredunes
8.4 (0.3)
8.1 (0.2)
7.8 (0.1)
7.4 (0.3)
H middle dunes
8.0 (0.1)
7.8 (0.2)
7.5 (0.8)
5.0 (0.5)
H hinter dunes
8.4 (0.2)
8.4 (0.3)
7.8 (0.3)
4.1 (0.1)
Wadden islands
7.9 (0.6)
7.3 (0.4)
6.6 (1.2)
4.2 (0.3)
Living biomass
(g m
-2
)
H foredunes
259 (130) 60 (22)
236 (116)
225 (36)
H middle dunes
250 (143) 49 (25)
189 (95)
220 (28)
H hinter dunes
232 (248) 78 (24)
186 (87)
125 (35)
Wadden islands
416 (248) 120 (50)
245 (99)
300 (350)
Foliar N:P ratio
(g g
-1
)
H fore dunes
10.1 (2.1) 11.0 (4.1) 13.8 (1.7)
16.0 (1.4)
H middle dunes
12.1 (1.5) 10.2 (2.4) 15.8 (5.7)
11.5 (0.7)
H hinter dunes
10.2 (1.9) 9.7 (3.5)
15.4 (1.5)
15.0 (1.4)
Wadden islands
9.1 (2.4)
9.6 (1.3)
7.4 (1.6)
13.0 (2.8)
H foredunes calcareous foredunes along the Holland coast in Meijendel, H middle dunes partly
decalcified middle dunes along the Holland coast in Zuid-Kennemerland, H hinter dunes acid
dunes along the Holland coast in Meijendel, Wadden islands acid dunes of the Wadden island
Terschellling
Mean values (and standard deviations)
15 Restoration of Dune Vegetation
243
15.3.1 Effect of Grazing on Dry Dune Vegetation
As indicated before, dry dune zones may differ in productivity, depending on the
availability of N and P (Kooijman et al. 1998; Kooijman and Hedenäs 2009;
Kooijman and Besse 2002). It is therefore not surprising that the effect of grazing
also depends on the productivity and nutrient limitations of the vegetation (Ten
Harkel and van der Meulen 1996).
In the foredunes along the Holland coast, grazing has a large and positive effect
on the percentage of open vegetation. The soil is calcareous, the pH is high and the
percentage of organic material is low. The availability of P is restricted by storage
in insoluble calcium phosphates, and the availability of N is relatively low because
of the high microbial demand and storage in the soil in stable organic matter.
Consequently, the productivity is also low and grazing has a relatively large impact
on the vegetation cover. The middle dunes along the Holland coast, however, are
highly productive and dominated by tall grasses and shrubs. The soils are partly
decalcified soils with pH values around 5, and all calcium phosphates have dissolved. Under such conditions, the productivity of the vegetation is barely restricted
by grazing (Table 15.2). In the oldest dunes in the hinterland of the Holland dunes,
and also in most of the dry dunes of the Wadden Sea islands, grazing has a marked
Table 15.1 Soil pH and plant characteristics of pioneer stages and reference dune grasslands in
different dune zones
Dune zone
Marram
grass
pioneer
stage
Open
pioneer
vegetation
Reference
dune
grasslands
Older
dune
grasslands
pH-H 2 O
H foredunes
8.4 (0.3)
8.1 (0.2)
7.8 (0.1)
7.4 (0.3)
H middle dunes
8.0 (0.1)
7.8 (0.2)
7.5 (0.8)
5.0 (0.5)
H hinter dunes
8.4 (0.2)
8.4 (0.3)
7.8 (0.3)
4.1 (0.1)
Wadden islands
7.9 (0.6)
7.3 (0.4)
6.6 (1.2)
4.2 (0.3)
Living biomass
(g m
-2
)
H foredunes
259 (130) 60 (22)
236 (116)
225 (36)
H middle dunes
250 (143) 49 (25)
189 (95)
220 (28)
H hinter dunes
232 (248) 78 (24)
186 (87)
125 (35)
Wadden islands
416 (248) 120 (50)
245 (99)
300 (350)
Foliar N:P ratio
(g g
-1
)
H fore dunes
10.1 (2.1) 11.0 (4.1) 13.8 (1.7)
16.0 (1.4)
H middle dunes
12.1 (1.5) 10.2 (2.4) 15.8 (5.7)
11.5 (0.7)
H hinter dunes
10.2 (1.9) 9.7 (3.5)
15.4 (1.5)
15.0 (1.4)
Wadden islands
9.1 (2.4)
9.6 (1.3)
7.4 (1.6)
13.0 (2.8)
H foredunes calcareous foredunes along the Holland coast in Meijendel, H middle dunes partly
decalcified middle dunes along the Holland coast in Zuid-Kennemerland, H hinter dunes acid
dunes along the Holland coast in Meijendel, Wadden islands acid dunes of the Wadden island
Terschellling
Mean values (and standard deviations)
15 Restoration of Dune Vegetation
243