

soil properties, such as the composition of soluble salts and electrical conductivity,
are related to the plant’s response to salinity.
14.4 Results
14.4.1 Vegetation
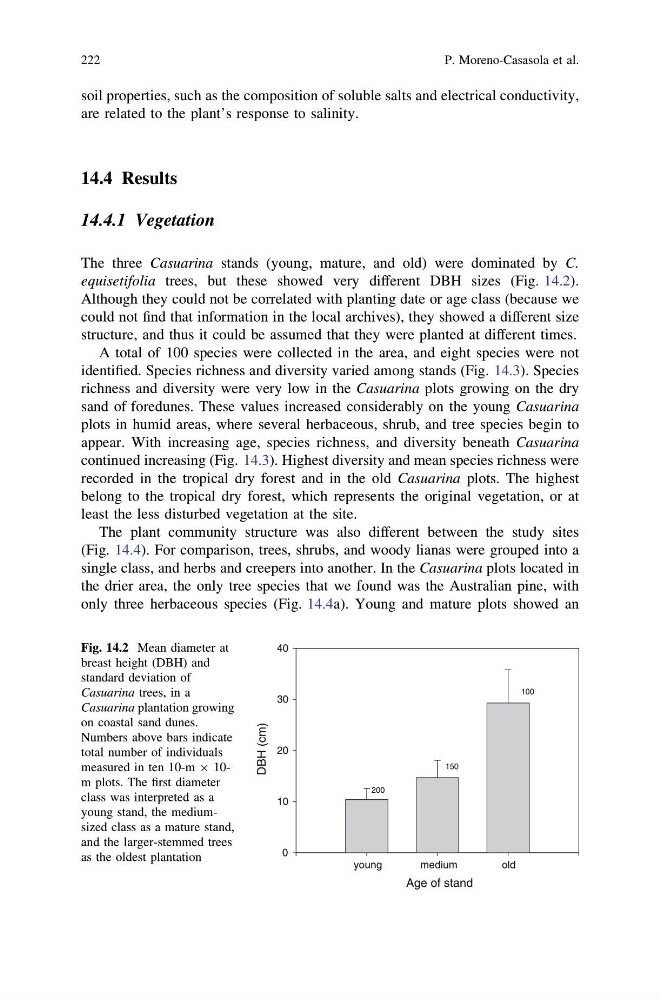
The three Casuarina stands (young, mature, and old) were dominated by C.
equisetifolia trees, but these showed very different DBH sizes (Fig. 14.2).
Although they could not be correlated with planting date or age class (because we
could not find that information in the local archives), they showed a different size
structure, and thus it could be assumed that they were planted at different times.
A total of 100 species were collected in the area, and eight species were not
identified. Species richness and diversity varied among stands (Fig. 14.3). Species
richness and diversity were very low in the Casuarina plots growing on the dry
sand of foredunes. These values increased considerably on the young Casuarina
plots in humid areas, where several herbaceous, shrub, and tree species begin to
appear. With increasing age, species richness, and diversity beneath Casuarina
continued increasing (Fig. 14.3). Highest diversity and mean species richness were
recorded in the tropical dry forest and in the old Casuarina plots. The highest
belong to the tropical dry forest, which represents the original vegetation, or at
least the less disturbed vegetation at the site.
The plant community structure was also different between the study sites
(Fig. 14.4). For comparison, trees, shrubs, and woody lianas were grouped into a
single class, and herbs and creepers into another. In the Casuarina plots located in
the drier area, the only tree species that we found was the Australian pine, with
only three herbaceous species (Fig. 14.4a). Young and mature plots showed an
Age of stand
young
medium
old
DBH (cm)
0
10
20
30
40
100
200
150
Fig. 14.2 Mean diameter at
breast height (DBH) and
standard deviation of
Casuarina trees, in a
Casuarina plantation growing
on coastal sand dunes.
Numbers above bars indicate
total number of individuals
measured in ten 10-m 9 10m plots. The first diameter
class was interpreted as a
young stand, the mediumsized class as a mature stand,
and the larger-stemmed trees
as the oldest plantation
222
P. Moreno-Casasola et al.
are related to the plant’s response to salinity.
14.4 Results
14.4.1 Vegetation
The three Casuarina stands (young, mature, and old) were dominated by C.
equisetifolia trees, but these showed very different DBH sizes (Fig. 14.2).
Although they could not be correlated with planting date or age class (because we
could not find that information in the local archives), they showed a different size
structure, and thus it could be assumed that they were planted at different times.
A total of 100 species were collected in the area, and eight species were not
identified. Species richness and diversity varied among stands (Fig. 14.3). Species
richness and diversity were very low in the Casuarina plots growing on the dry
sand of foredunes. These values increased considerably on the young Casuarina
plots in humid areas, where several herbaceous, shrub, and tree species begin to
appear. With increasing age, species richness, and diversity beneath Casuarina
continued increasing (Fig. 14.3). Highest diversity and mean species richness were
recorded in the tropical dry forest and in the old Casuarina plots. The highest
belong to the tropical dry forest, which represents the original vegetation, or at
least the less disturbed vegetation at the site.
The plant community structure was also different between the study sites
(Fig. 14.4). For comparison, trees, shrubs, and woody lianas were grouped into a
single class, and herbs and creepers into another. In the Casuarina plots located in
the drier area, the only tree species that we found was the Australian pine, with
only three herbaceous species (Fig. 14.4a). Young and mature plots showed an
Age of stand
young
medium
old
DBH (cm)
0
10
20
30
40
100
200
150
Fig. 14.2 Mean diameter at
breast height (DBH) and
standard deviation of
Casuarina trees, in a
Casuarina plantation growing
on coastal sand dunes.
Numbers above bars indicate
total number of individuals
measured in ten 10-m 9 10m plots. The first diameter
class was interpreted as a
young stand, the mediumsized class as a mature stand,
and the larger-stemmed trees
as the oldest plantation
222
P. Moreno-Casasola et al.