

41.2 Land
41.2.1 Agricultural Land vs. Cultivated Agricultural Land
Viewed from a Global Perspective
Nowadays, a total of 5.01 billion hectares – representing 3.07% of the Earth’s
overall land mass – is being used for agricultural purposes (Lup 2014).
Out of this hectarage, 1.4 billion hectares (i.e. 29%) represents arable land, while
69% is made up of permanent meadows and pastures, and 2% is made up of
perennial crops. When considered against the world population, agricultural
resources ensure an average of 0.82 ha per capita of which 0.23 ha is made up of
arable land.
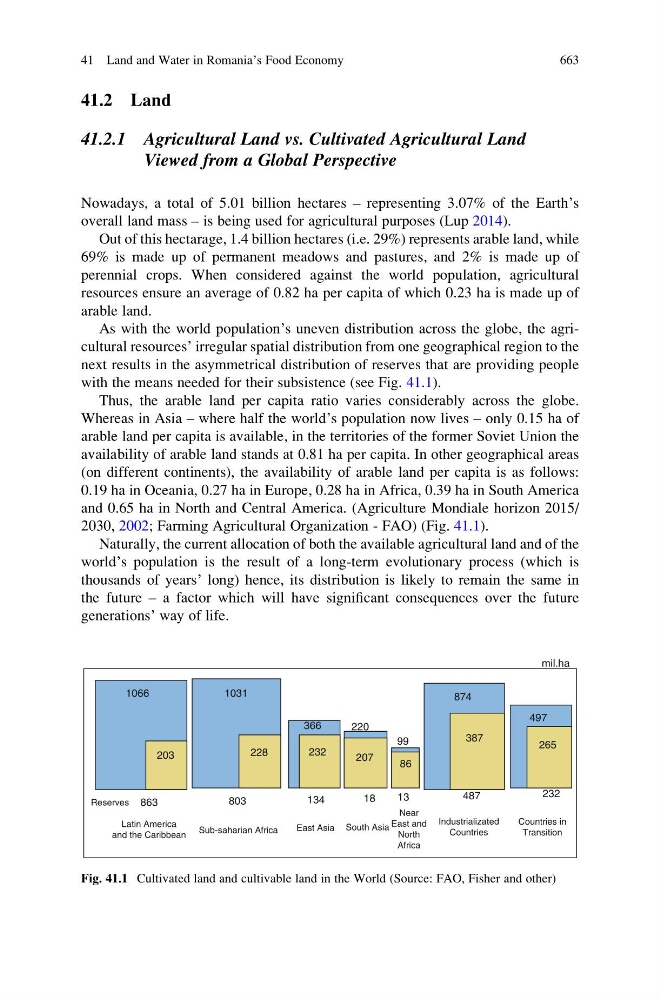
As with the world population’s uneven distribution across the globe, the agricultural resources’ irregular spatial distribution from one geographical region to the
next results in the asymmetrical distribution of reserves that are providing people
with the means needed for their subsistence (see Fig. 41.1).
Thus, the arable land per capita ratio varies considerably across the globe.
Whereas in Asia – where half the world’s population now lives – only 0.15 ha of
arable land per capita is available, in the territories of the former Soviet Union the
availability of arable land stands at 0.81 ha per capita. In other geographical areas
(on different continents), the availability of arable land per capita is as follows:
0.19 ha in Oceania, 0.27 ha in Europe, 0.28 ha in Africa, 0.39 ha in South America
and 0.65 ha in North and Central America. (Agriculture Mondiale horizon 2015/
2030, 2002; Farming Agricultural Organization - FAO) (Fig. 41.1).
Naturally, the current allocation of both the available agricultural land and of the
world’s population is the result of a long-term evolutionary process (which is
thousands of years’ long) hence, its distribution is likely to remain the same in
the future – a factor which will have significant consequences over the future
generations’ way of life.
1066
1031
203
228
366
220
207
99
874
387
mil.ha
497
265
232
487
13
18
134
803
863
Reserves
Latin America
and the Caribbean
Sub-saharian Africa
East Asia South Asia
Near
East and
North
Africa
Industrializated
Countries
Countries in
Transition
86
232
Fig. 41.1 Cultivated land and cultivable land in the World (Source: FAO, Fisher and other)
41 Land and Water in Romania’s Food Economy
663