

25.6 Institutional and Organizational Context of SSF:
Capacity for Collective Action and Influence
on Governance Arrangements
25.6.1 Summary of the Strengths and Weaknesses
of the Fleet Management System
According to the national legislation all fishing vessels used for commercial fishing,
should be first registered in the fishing vessels register, kept by Executive Agency
“Maritime administration” (the Bulgarian authority/institution, responsible for the
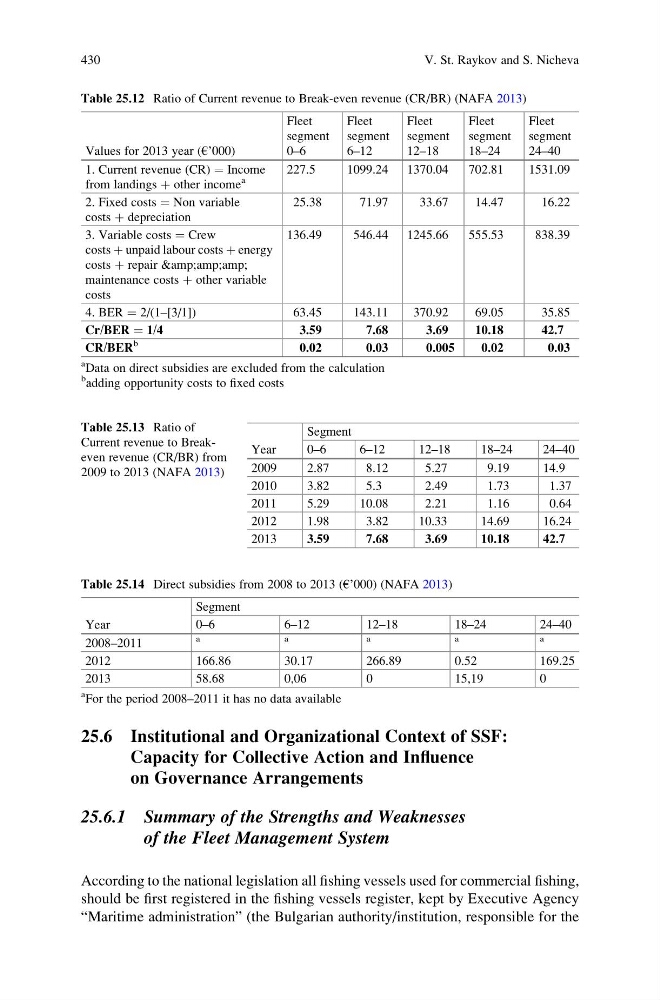
Table 25.12 Ratio of Current revenue to Break-even revenue (CR/BR) (NAFA 2013)
Values for 2013 year (€’000)
Fleet
segment
0–6
Fleet
segment
6–12
Fleet
segment
12–18
Fleet
segment
18–24
Fleet
segment
24–40
1. Current revenue (CR) ¼ Income
from landings þ other income
a
227.5
1099.24 1370.04
702.81
1531.09
2. Fixed costs ¼ Non variable
costs þ depreciation
25.38
71.97
33.67
14.47
16.22
3. Variable costs ¼ Crew
costs þ unpaid labour costs þ energy
costs þ repair &
maintenance costs þ other variable
costs
136.49
546.44 1245.66
555.53
838.39
4. BER ¼ 2/(1–[3/1])
63.45
143.11
370.92
69.05
35.85
Cr/BER ¼ 1/4
3.59
7.68
3.69
10.18
42.7
CR/BER
b
0.02
0.03
0.005
0.02
0.03
a
Data on direct subsidies are excluded from the calculation
b
adding opportunity costs to fixed costs
Table 25.13 Ratio of
Current revenue to Breakeven revenue (CR/BR) from
2009 to 2013 (NAFA 2013)
Year
Segment
0–6
6–12
12–18
18–24
24–40
2009
2.87
8.12
5.27
9.19
14.9
2010
3.82
5.3
2.49
1.73
1.37
2011
5.29
10.08
2.21
1.16
0.64
2012
1.98
3.82
10.33
14.69
16.24
2013
3.59
7.68
3.69
10.18
42.7
Table 25.14 Direct subsidies from 2008 to 2013 (€’000) (NAFA 2013)
Year
Segment
0–6
6–12
12–18
18–24
24–40
2008–2011
a
a
a
a
a
2012
166.86
30.17
266.89
0.52
169.25
2013
58.68
0,06
0
15,19
0
a
For the period 2008–2011 it has no data available
430
V. St. Raykov and S. Nicheva
Capacity for Collective Action and Influence
on Governance Arrangements
25.6.1 Summary of the Strengths and Weaknesses
of the Fleet Management System
According to the national legislation all fishing vessels used for commercial fishing,
should be first registered in the fishing vessels register, kept by Executive Agency
“Maritime administration” (the Bulgarian authority/institution, responsible for the
Table 25.12 Ratio of Current revenue to Break-even revenue (CR/BR) (NAFA 2013)
Values for 2013 year (€’000)
Fleet
segment
0–6
Fleet
segment
6–12
Fleet
segment
12–18
Fleet
segment
18–24
Fleet
segment
24–40
1. Current revenue (CR) ¼ Income
from landings þ other income
a
227.5
1099.24 1370.04
702.81
1531.09
2. Fixed costs ¼ Non variable
costs þ depreciation
25.38
71.97
33.67
14.47
16.22
3. Variable costs ¼ Crew
costs þ unpaid labour costs þ energy
costs þ repair &
maintenance costs þ other variable
costs
136.49
546.44 1245.66
555.53
838.39
4. BER ¼ 2/(1–[3/1])
63.45
143.11
370.92
69.05
35.85
Cr/BER ¼ 1/4
3.59
7.68
3.69
10.18
42.7
CR/BER
b
0.02
0.03
0.005
0.02
0.03
a
Data on direct subsidies are excluded from the calculation
b
adding opportunity costs to fixed costs
Table 25.13 Ratio of
Current revenue to Breakeven revenue (CR/BR) from
2009 to 2013 (NAFA 2013)
Year
Segment
0–6
6–12
12–18
18–24
24–40
2009
2.87
8.12
5.27
9.19
14.9
2010
3.82
5.3
2.49
1.73
1.37
2011
5.29
10.08
2.21
1.16
0.64
2012
1.98
3.82
10.33
14.69
16.24
2013
3.59
7.68
3.69
10.18
42.7
Table 25.14 Direct subsidies from 2008 to 2013 (€’000) (NAFA 2013)
Year
Segment
0–6
6–12
12–18
18–24
24–40
2008–2011
a
a
a
a
a
2012
166.86
30.17
266.89
0.52
169.25
2013
58.68
0,06
0
15,19
0
a
For the period 2008–2011 it has no data available
430
V. St. Raykov and S. Nicheva