

25.5.1 Return on Investment (ROI)
ROI is an indicator, which shows the return rate of the investments, made during the
year. Values of ROI for segments 6–12 and 24–40 shows that extraordinary profits
are being generated which contribute to net profit’s values of these segments
(Table 25.10).
The value of ROI for the segment 12–18 indicates that in the long term the
segment is overcapitalized and therefore economically inefficient. Incomes from
the activity of vessels in this segment are close in value to the cost declared.
Table 25.11. shows the values of the indicator ROI for the period 2009–2013.
The results of the indicator for 2013 calculated according to Guidelines for the
analysis of the balance between fishing capacity and fishing opportunities according
to Art 22 of Regulation (EU) No 1380/2013 of the European Parliament and the
Council on the Common Fisheries Policy (COM(2014) 545 final). Data on direct
income subsidies are excluded from the calculation.
Ratio between current revenue and break-even revenue (CR/BER).
For 2013 the indicator CR/BER is calculated in the short and long term
(Table 25.12.)
In the short term, the results shows that all segments are profitable and they are
able to cover their costs (fixed costs, variable costs, capital costs). The indicator
CR/BER for all segments is above 1. The highest value of the indicator CR/BER is
for the segment 24–40. In view of the long-term viability in the calculation of
CR/BER also include opportunity costs. In this case, the results for all segments are
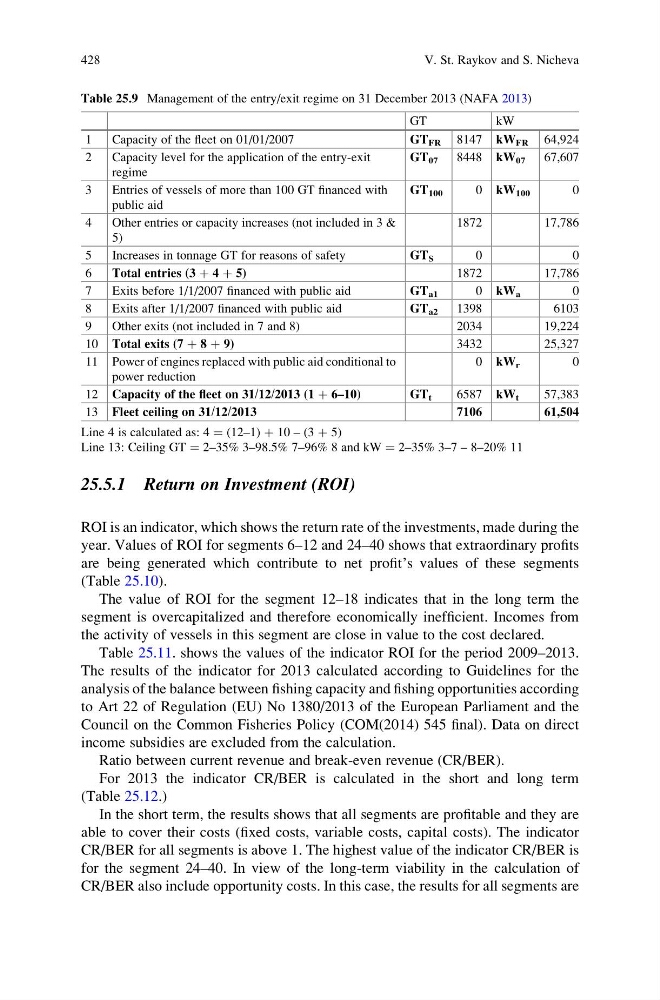
Table 25.9 Management of the entry/exit regime on 31 December 2013 (NAFA 2013)
GT
kW
1
Capacity of the fleet on 01/01/2007
GT FR 8147 kW FR 64,924
2
Capacity level for the application of the entry-exit
regime
GT 07 8448 kW 07 67,607
3
Entries of vessels of more than 100 GT financed with
public aid
GT 100
0 kW 100
0
4
Other entries or capacity increases (not included in 3 &
5)
1872
17,786
5
Increases in tonnage GT for reasons of safety
GT S
0
0
6
Total entries (3 þ 4 þ 5)
1872
17,786
7
Exits before 1/1/2007 financed with public aid
GT a1
0 kW a
0
8
Exits after 1/1/2007 financed with public aid
GT a2 1398
6103
9
Other exits (not included in 7 and 8)
2034
19,224
10 Total exits (7 þ 8 þ 9)
3432
25,327
11 Power of engines replaced with public aid conditional to
power reduction
0 kW r
0
12 Capacity of the fleet on 31/12/2013 (1 þ 6–10)
GT t
6587 kW t
57,383
13 Fleet ceiling on 31/12/2013
7106
61,504
Line 4 is calculated as: 4 ¼ (12–1) þ 10 – (3 þ 5)
Line 13: Ceiling GT ¼ 2–35% 3–98.5% 7–96% 8 and kW ¼ 2–35% 3–7 – 8–20% 11
428
V. St. Raykov and S. Nicheva
ROI is an indicator, which shows the return rate of the investments, made during the
year. Values of ROI for segments 6–12 and 24–40 shows that extraordinary profits
are being generated which contribute to net profit’s values of these segments
(Table 25.10).
The value of ROI for the segment 12–18 indicates that in the long term the
segment is overcapitalized and therefore economically inefficient. Incomes from
the activity of vessels in this segment are close in value to the cost declared.
Table 25.11. shows the values of the indicator ROI for the period 2009–2013.
The results of the indicator for 2013 calculated according to Guidelines for the
analysis of the balance between fishing capacity and fishing opportunities according
to Art 22 of Regulation (EU) No 1380/2013 of the European Parliament and the
Council on the Common Fisheries Policy (COM(2014) 545 final). Data on direct
income subsidies are excluded from the calculation.
Ratio between current revenue and break-even revenue (CR/BER).
For 2013 the indicator CR/BER is calculated in the short and long term
(Table 25.12.)
In the short term, the results shows that all segments are profitable and they are
able to cover their costs (fixed costs, variable costs, capital costs). The indicator
CR/BER for all segments is above 1. The highest value of the indicator CR/BER is
for the segment 24–40. In view of the long-term viability in the calculation of
CR/BER also include opportunity costs. In this case, the results for all segments are
Table 25.9 Management of the entry/exit regime on 31 December 2013 (NAFA 2013)
GT
kW
1
Capacity of the fleet on 01/01/2007
GT FR 8147 kW FR 64,924
2
Capacity level for the application of the entry-exit
regime
GT 07 8448 kW 07 67,607
3
Entries of vessels of more than 100 GT financed with
public aid
GT 100
0 kW 100
0
4
Other entries or capacity increases (not included in 3 &
5)
1872
17,786
5
Increases in tonnage GT for reasons of safety
GT S
0
0
6
Total entries (3 þ 4 þ 5)
1872
17,786
7
Exits before 1/1/2007 financed with public aid
GT a1
0 kW a
0
8
Exits after 1/1/2007 financed with public aid
GT a2 1398
6103
9
Other exits (not included in 7 and 8)
2034
19,224
10 Total exits (7 þ 8 þ 9)
3432
25,327
11 Power of engines replaced with public aid conditional to
power reduction
0 kW r
0
12 Capacity of the fleet on 31/12/2013 (1 þ 6–10)
GT t
6587 kW t
57,383
13 Fleet ceiling on 31/12/2013
7106
61,504
Line 4 is calculated as: 4 ¼ (12–1) þ 10 – (3 þ 5)
Line 13: Ceiling GT ¼ 2–35% 3–98.5% 7–96% 8 and kW ¼ 2–35% 3–7 – 8–20% 11
428
V. St. Raykov and S. Nicheva