

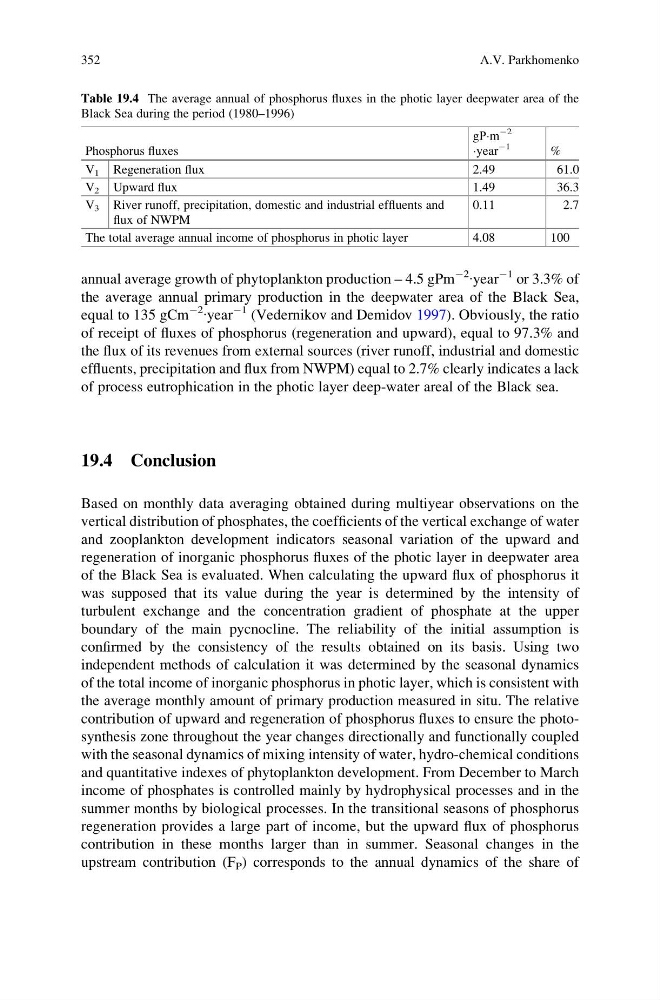
annual average growth of phytoplankton production – 4.5 gPm
À2
∙year
À1 or 3.3% of
the average annual primary production in the deepwater area of the Black Sea,
equal to 135 gCm
À2 ∙year
À1 (Vedernikov and Demidov 1997). Obviously, the ratio
of receipt of fluxes of phosphorus (regeneration and upward), equal to 97.3% and
the flux of its revenues from external sources (river runoff, industrial and domestic
effluents, precipitation and flux from NWPM) equal to 2.7% clearly indicates a lack
of process eutrophication in the photic layer deep-water areal of the Black sea.
19.4 Conclusion
Based on monthly data averaging obtained during multiyear observations on the
vertical distribution of phosphates, the coefficients of the vertical exchange of water
and zooplankton development indicators seasonal variation of the upward and
regeneration of inorganic phosphorus fluxes of the photic layer in deepwater area
of the Black Sea is evaluated. When calculating the upward flux of phosphorus it
was supposed that its value during the year is determined by the intensity of
turbulent exchange and the concentration gradient of phosphate at the upper
boundary of the main pycnocline. The reliability of the initial assumption is
confirmed by the consistency of the results obtained on its basis. Using two
independent methods of calculation it was determined by the seasonal dynamics
of the total income of inorganic phosphorus in photic layer, which is consistent with
the average monthly amount of primary production measured in situ. The relative
contribution of upward and regeneration of phosphorus fluxes to ensure the photosynthesis zone throughout the year changes directionally and functionally coupled
with the seasonal dynamics of mixing intensity of water, hydro-chemical conditions
and quantitative indexes of phytoplankton development. From December to March
income of phosphates is controlled mainly by hydrophysical processes and in the
summer months by biological processes. In the transitional seasons of phosphorus
regeneration provides a large part of income, but the upward flux of phosphorus
contribution in these months larger than in summer. Seasonal changes in the
upstream contribution (F P ) corresponds to the annual dynamics of the share of
Table 19.4 The average annual of phosphorus fluxes in the photic layer deepwater area of the
Black Sea during the period (1980–1996)
Phosphorus fluxes
gРÁm
À2
Áyear
À1
%
V 1 Regeneration flux
2.49
61.0
V 2 Upward flux
1.49
36.3
V 3 River runoff, precipitation, domestic and industrial effluents and
flux of NWPM
0.11
2.7
The total average annual income of phosphorus in photic layer
4.08
100
352
A.V. Parkhomenko
À2
∙year
À1 or 3.3% of
the average annual primary production in the deepwater area of the Black Sea,
equal to 135 gCm
À2 ∙year
À1 (Vedernikov and Demidov 1997). Obviously, the ratio
of receipt of fluxes of phosphorus (regeneration and upward), equal to 97.3% and
the flux of its revenues from external sources (river runoff, industrial and domestic
effluents, precipitation and flux from NWPM) equal to 2.7% clearly indicates a lack
of process eutrophication in the photic layer deep-water areal of the Black sea.
19.4 Conclusion
Based on monthly data averaging obtained during multiyear observations on the
vertical distribution of phosphates, the coefficients of the vertical exchange of water
and zooplankton development indicators seasonal variation of the upward and
regeneration of inorganic phosphorus fluxes of the photic layer in deepwater area
of the Black Sea is evaluated. When calculating the upward flux of phosphorus it
was supposed that its value during the year is determined by the intensity of
turbulent exchange and the concentration gradient of phosphate at the upper
boundary of the main pycnocline. The reliability of the initial assumption is
confirmed by the consistency of the results obtained on its basis. Using two
independent methods of calculation it was determined by the seasonal dynamics
of the total income of inorganic phosphorus in photic layer, which is consistent with
the average monthly amount of primary production measured in situ. The relative
contribution of upward and regeneration of phosphorus fluxes to ensure the photosynthesis zone throughout the year changes directionally and functionally coupled
with the seasonal dynamics of mixing intensity of water, hydro-chemical conditions
and quantitative indexes of phytoplankton development. From December to March
income of phosphates is controlled mainly by hydrophysical processes and in the
summer months by biological processes. In the transitional seasons of phosphorus
regeneration provides a large part of income, but the upward flux of phosphorus
contribution in these months larger than in summer. Seasonal changes in the
upstream contribution (F P ) corresponds to the annual dynamics of the share of
Table 19.4 The average annual of phosphorus fluxes in the photic layer deepwater area of the
Black Sea during the period (1980–1996)
Phosphorus fluxes
gРÁm
À2
Áyear
À1
%
V 1 Regeneration flux
2.49
61.0
V 2 Upward flux
1.49
36.3
V 3 River runoff, precipitation, domestic and industrial effluents and
flux of NWPM
0.11
2.7
The total average annual income of phosphorus in photic layer
4.08
100
352
A.V. Parkhomenko