

course – 362 km
3
∙year
À1 and into the Black Sea by lower course – 145 km
3
∙year
À1 .
Estimates of the
239þ240 Pu fluxes in different periods after the accident on the
ChNPP through the Bosporus Strait were made on the basis of data on the
239þ240
Pu concentration activity in marine surface waters in the Black Sea (Tereshchenko
et al. 2014, 2016) and Mediterranean Sea (WOMARS 2005; Tereshchenko et al.
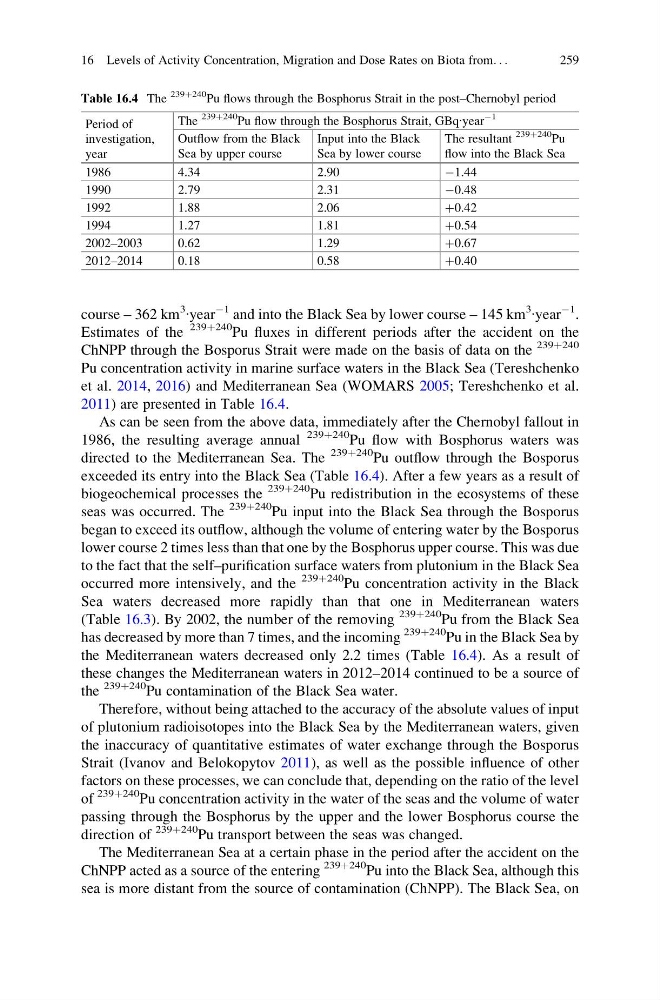
2011) are presented in Table 16.4.
As can be seen from the above data, immediately after the Chernobyl fallout in
1986, the resulting average annual
239þ240 Pu flow with Bosphorus waters was
directed to the Mediterranean Sea. The
239þ240 Pu outflow through the Bosporus
exceeded its entry into the Black Sea (Table 16.4). After a few years as a result of
biogeochemical processes the
239þ240 Pu redistribution in the ecosystems of these
seas was occurred. The
239þ240 Pu input into the Black Sea through the Bosporus
began to exceed its outflow, although the volume of entering water by the Bosporus
lower course 2 times less than that one by the Bosphorus upper course. This was due
to the fact that the self–purification surface waters from plutonium in the Black Sea
occurred more intensively, and the
239þ240 Pu concentration activity in the Black
Sea waters decreased more rapidly than that one in Mediterranean waters
(Table 16.3). By 2002, the number of the removing
239þ240 Pu from the Black Sea
has decreased by more than 7 times, and the incoming
239þ240 Pu in the Black Sea by
the Mediterranean waters decreased only 2.2 times (Table 16.4). As a result of
these changes the Mediterranean waters in 2012–2014 continued to be a source of
the
239þ240 Pu contamination of the Black Sea water.
Therefore, without being attached to the accuracy of the absolute values of input
of plutonium radioisotopes into the Black Sea by the Mediterranean waters, given
the inaccuracy of quantitative estimates of water exchange through the Bosporus
Strait (Ivanov and Belokopytov 2011), as well as the possible influence of other
factors on these processes, we can conclude that, depending on the ratio of the level
of
239þ240 Pu concentration activity in the water of the seas and the volume of water
passing through the Bosphorus by the upper and the lower Bosphorus course the
direction of
239þ240 Pu transport between the seas was changed.
The Mediterranean Sea at a certain phase in the period after the accident on the
ChNPP acted as a source of the entering
239þ240 Pu into the Black Sea, although this
sea is more distant from the source of contamination (ChNPP). The Black Sea, on
Table 16.4 The
239þ240
Pu flows through the Bosphorus Strait in the post–Chernobyl period
Period of
investigation,
year
The
239þ240
Pu flow through the Bosphorus Strait, GBq∙year
À1
Outflow from the Black
Sea by upper course
Input into the Black
Sea by lower course
The resultant
239þ240
Pu
flow into the Black Sea
1986
4.34
2.90
À1.44
1990
2.79
2.31
À0.48
1992
1.88
2.06
þ0.42
1994
1.27
1.81
þ0.54
2002–2003
0.62
1.29
þ0.67
2012–2014
0.18
0.58
þ0.40
16 Levels of Activity Concentration, Migration and Dose Rates on Biota from. . .
259
3
∙year
À1 and into the Black Sea by lower course – 145 km
3
∙year
À1 .
Estimates of the
239þ240 Pu fluxes in different periods after the accident on the
ChNPP through the Bosporus Strait were made on the basis of data on the
239þ240
Pu concentration activity in marine surface waters in the Black Sea (Tereshchenko
et al. 2014, 2016) and Mediterranean Sea (WOMARS 2005; Tereshchenko et al.
2011) are presented in Table 16.4.
As can be seen from the above data, immediately after the Chernobyl fallout in
1986, the resulting average annual
239þ240 Pu flow with Bosphorus waters was
directed to the Mediterranean Sea. The
239þ240 Pu outflow through the Bosporus
exceeded its entry into the Black Sea (Table 16.4). After a few years as a result of
biogeochemical processes the
239þ240 Pu redistribution in the ecosystems of these
seas was occurred. The
239þ240 Pu input into the Black Sea through the Bosporus
began to exceed its outflow, although the volume of entering water by the Bosporus
lower course 2 times less than that one by the Bosphorus upper course. This was due
to the fact that the self–purification surface waters from plutonium in the Black Sea
occurred more intensively, and the
239þ240 Pu concentration activity in the Black
Sea waters decreased more rapidly than that one in Mediterranean waters
(Table 16.3). By 2002, the number of the removing
239þ240 Pu from the Black Sea
has decreased by more than 7 times, and the incoming
239þ240 Pu in the Black Sea by
the Mediterranean waters decreased only 2.2 times (Table 16.4). As a result of
these changes the Mediterranean waters in 2012–2014 continued to be a source of
the
239þ240 Pu contamination of the Black Sea water.
Therefore, without being attached to the accuracy of the absolute values of input
of plutonium radioisotopes into the Black Sea by the Mediterranean waters, given
the inaccuracy of quantitative estimates of water exchange through the Bosporus
Strait (Ivanov and Belokopytov 2011), as well as the possible influence of other
factors on these processes, we can conclude that, depending on the ratio of the level
of
239þ240 Pu concentration activity in the water of the seas and the volume of water
passing through the Bosphorus by the upper and the lower Bosphorus course the
direction of
239þ240 Pu transport between the seas was changed.
The Mediterranean Sea at a certain phase in the period after the accident on the
ChNPP acted as a source of the entering
239þ240 Pu into the Black Sea, although this
sea is more distant from the source of contamination (ChNPP). The Black Sea, on
Table 16.4 The
239þ240
Pu flows through the Bosphorus Strait in the post–Chernobyl period
Period of
investigation,
year
The
239þ240
Pu flow through the Bosphorus Strait, GBq∙year
À1
Outflow from the Black
Sea by upper course
Input into the Black
Sea by lower course
The resultant
239þ240
Pu
flow into the Black Sea
1986
4.34
2.90
À1.44
1990
2.79
2.31
À0.48
1992
1.88
2.06
þ0.42
1994
1.27
1.81
þ0.54
2002–2003
0.62
1.29
þ0.67
2012–2014
0.18
0.58
þ0.40
16 Levels of Activity Concentration, Migration and Dose Rates on Biota from. . .
259