

pinges out where the Corbiro-Gaviera-Ca~ non changes its direction to the NW. The
dominating structures trend E–W following the general trend of tectonic thrusts.
They are intersected and partly displaced by NW–SE structures, which represent
the younger dextral transform shear zones (Alvarez-Marro ´n et al. 1997; Go ´mezBallesteros et al. 2014).
11.2 Methods
Watermass dynamics were studies applying a conductivity, temperature, and depth
profiler (CTD) as well as a small scale lander in order to obtain time series data of
pressure, temperature, salinity and currents.
11.2.1 CTD Profiler
The CTD profiler used for investigation of the water column during METEOR
cruise M84/5 (May–June 2011) was a SEABIRD “SBE 9 plus” underwater unit and
a SEABIRD “SBE 11plus V2” deck unit. Additionally, it was equipped with two
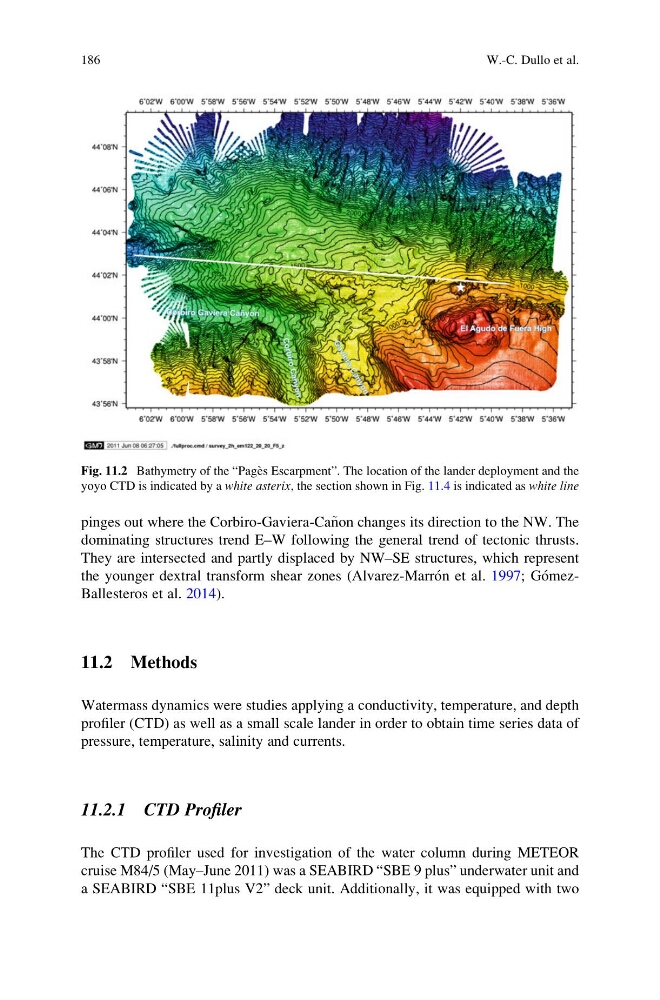
Fig. 11.2 Bathymetry of the “Page `s Escarpment”. The location of the lander deployment and the
yoyo CTD is indicated by a white asterix, the section shown in Fig. 11.4 is indicated as white line
186
W.-C. Dullo et al.
dominating structures trend E–W following the general trend of tectonic thrusts.
They are intersected and partly displaced by NW–SE structures, which represent
the younger dextral transform shear zones (Alvarez-Marro ´n et al. 1997; Go ´mezBallesteros et al. 2014).
11.2 Methods
Watermass dynamics were studies applying a conductivity, temperature, and depth
profiler (CTD) as well as a small scale lander in order to obtain time series data of
pressure, temperature, salinity and currents.
11.2.1 CTD Profiler
The CTD profiler used for investigation of the water column during METEOR
cruise M84/5 (May–June 2011) was a SEABIRD “SBE 9 plus” underwater unit and
a SEABIRD “SBE 11plus V2” deck unit. Additionally, it was equipped with two
Fig. 11.2 Bathymetry of the “Page `s Escarpment”. The location of the lander deployment and the
yoyo CTD is indicated by a white asterix, the section shown in Fig. 11.4 is indicated as white line
186
W.-C. Dullo et al.