

100
5 Challenges: Sectoral Descriptions
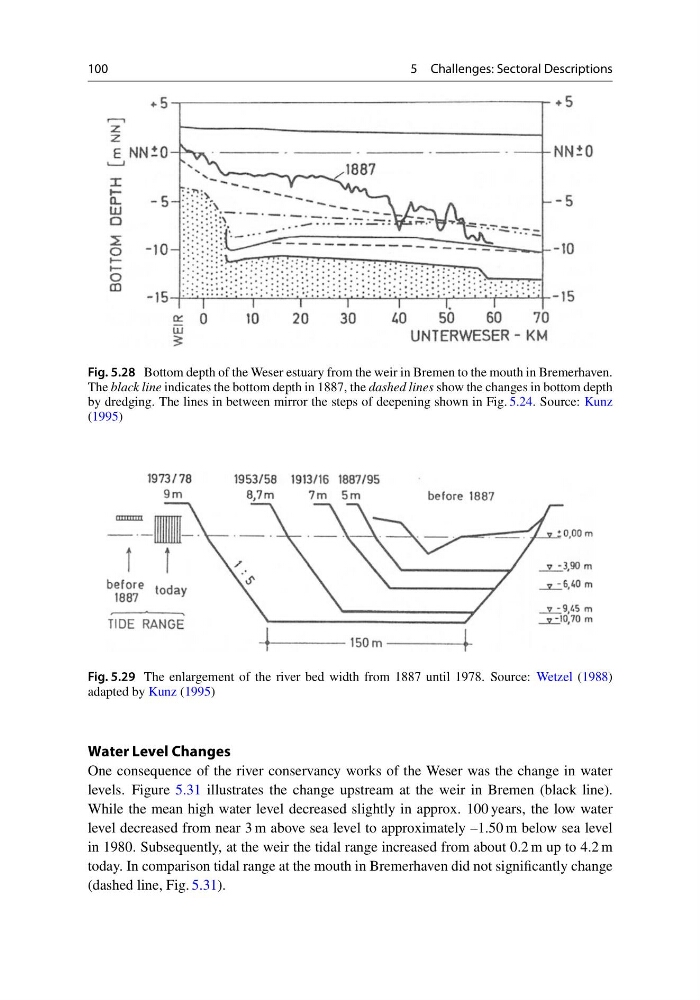
Fig. 5.28 Bottom depth of the Weser estuary from the weir in Bremen to the mouth in Bremerhaven.
The black line indicates the bottom depth in 1887, the dashed lines show the changes in bottom depth
by dredging. The lines in between mirror the steps of deepening shown in Fig. 5.24. Source: Kunz
(1995)
Fig. 5.29 The enlargement of the river bed width from 1887 until 1978. Source: Wetzel (1988)
adapted by Kunz (1995)
Water Level Changes
One consequence of the river conservancy works of the Weser was the change in water
levels. Figure 5.31 illustrates the change upstream at the weir in Bremen (black line).
While the mean high water level decreased slightly in approx. 100 years, the low water
level decreased from near 3 m above sea level to approximately –1.50 m below sea level
in 1980. Subsequently, at the weir the tidal range increased from about 0.2 m up to 4.2 m
today. In comparison tidal range at the mouth in Bremerhaven did not significantly change
(dashed line, Fig. 5.31).
5 Challenges: Sectoral Descriptions
Fig. 5.28 Bottom depth of the Weser estuary from the weir in Bremen to the mouth in Bremerhaven.
The black line indicates the bottom depth in 1887, the dashed lines show the changes in bottom depth
by dredging. The lines in between mirror the steps of deepening shown in Fig. 5.24. Source: Kunz
(1995)
Fig. 5.29 The enlargement of the river bed width from 1887 until 1978. Source: Wetzel (1988)
adapted by Kunz (1995)
Water Level Changes
One consequence of the river conservancy works of the Weser was the change in water
levels. Figure 5.31 illustrates the change upstream at the weir in Bremen (black line).
While the mean high water level decreased slightly in approx. 100 years, the low water
level decreased from near 3 m above sea level to approximately –1.50 m below sea level
in 1980. Subsequently, at the weir the tidal range increased from about 0.2 m up to 4.2 m
today. In comparison tidal range at the mouth in Bremerhaven did not significantly change
(dashed line, Fig. 5.31).