

366
Appendix 2
100
80
~ 60
<{
IZ
W
U
a::
w 40
Q.
20
-30" -20" - 10"
CUMULATIVE NORMAL
DISTRIBUTION FUNCTION
NORMAL PROBABILITY
/
DENSITY FUNCTION
2.1%
10"
20"
3 0"
-68.3'10
- - - 95.5% -
- - - -- 99.7% - -- - _
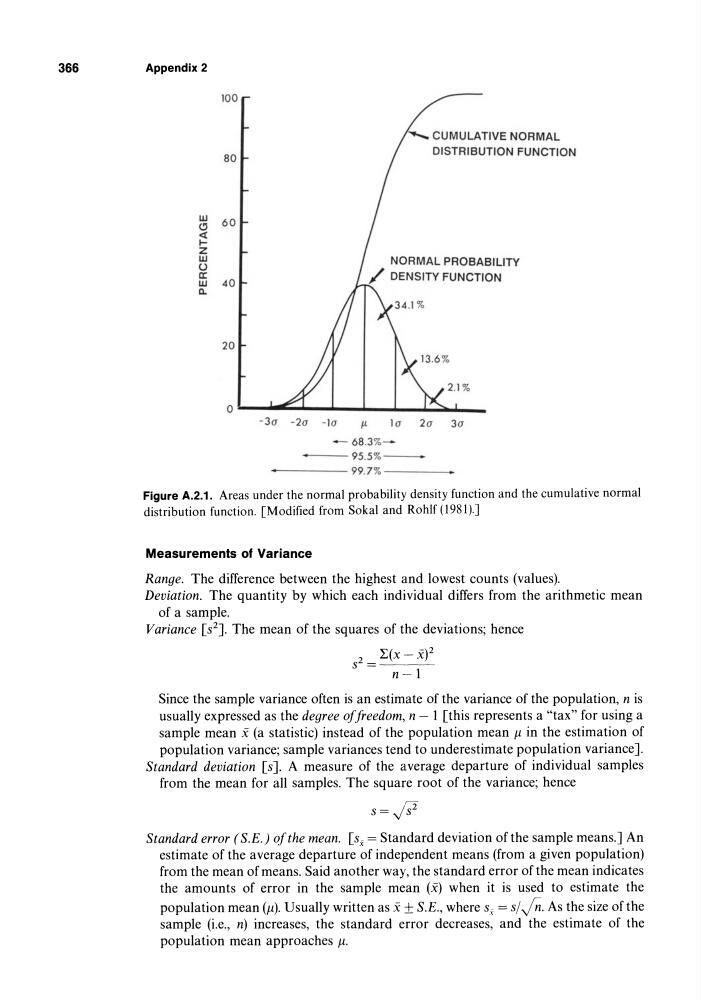
Figure A.2.1. Areas under the normal probability density function and the cumulative normal
distribution function. [Modified from Sokal and Rohlf (1981 ).]
Measurements of Variance
Range. The difference between the highest and lowest counts (values).
Deviation. The quantity by which each individual differs from the arithmetic mean
of a sample.
Variance [S2]. The mean of the squares of the deviations; hence
2
L(X -XY
s = ---~
n-l
Since the sample variance often is an estimate of the variance of the population, n is
usually expressed as the degree offreedom, n - 1 [this represents a "tax" for using a
sample mean x (a statistic) instead of the population mean fl in the estimation of
population variance; sample variances tend to underestimate popUlation variance].
Standard deviation [s]. A measure of the average departure of individual samples
from the mean for all samples. The square root of the variance; hence
s = ./lStandard error (S.E.) of the mean. [Si = Standard deviation of the sample means.] An
estimate of the average departure of independent means (from a given population)
from the mean of means. Said another way, the standard error of the mean indicates
the amounts of error in the sample mean (x) when it is used to estimate the
population mean (fl). Usually written as x ± S.E. , where s, = s/ In. As the size of the
sample (i.e., n) increases, the standard error decreases, and the estimate of the
population mean approaches fl.
Appendix 2
100
80
~ 60
<{
IZ
W
U
a::
w 40
Q.
20
-30" -20" - 10"
CUMULATIVE NORMAL
DISTRIBUTION FUNCTION
NORMAL PROBABILITY
/
DENSITY FUNCTION
2.1%
10"
20"
3 0"
-68.3'10
- - - 95.5% -
- - - -- 99.7% - -- - _
Figure A.2.1. Areas under the normal probability density function and the cumulative normal
distribution function. [Modified from Sokal and Rohlf (1981 ).]
Measurements of Variance
Range. The difference between the highest and lowest counts (values).
Deviation. The quantity by which each individual differs from the arithmetic mean
of a sample.
Variance [S2]. The mean of the squares of the deviations; hence
2
L(X -XY
s = ---~
n-l
Since the sample variance often is an estimate of the variance of the population, n is
usually expressed as the degree offreedom, n - 1 [this represents a "tax" for using a
sample mean x (a statistic) instead of the population mean fl in the estimation of
population variance; sample variances tend to underestimate popUlation variance].
Standard deviation [s]. A measure of the average departure of individual samples
from the mean for all samples. The square root of the variance; hence
s = ./lStandard error (S.E.) of the mean. [Si = Standard deviation of the sample means.] An
estimate of the average departure of independent means (from a given population)
from the mean of means. Said another way, the standard error of the mean indicates
the amounts of error in the sample mean (x) when it is used to estimate the
population mean (fl). Usually written as x ± S.E. , where s, = s/ In. As the size of the
sample (i.e., n) increases, the standard error decreases, and the estimate of the
population mean approaches fl.