

356
Exercise 29
3. From bathymetric maps, determine the volume of each stratum of the hypolimnion and the
total volume of the epilimnion and the hypolimnion, as outlined in Exercise 1.
4. A minimum of two sets of such data are needed, separated by about three to four weeks.
5. Often the measurements needed for these computations of whole lake metabolism can be
obtained while performing the analyses for other exercises. The strength of these analyses is
increased when they can be compared to other analyses of productivity or biomass, e.g., in situ
rates of productivity of phytoplankton, algal biomass, and other parameters.
6. If possible, split the class into teams, each of which performs the analyses of Oz deficit and
COz accumulation on different lake systems, e.g., a relatively oligotrophic lake versus a
europhic lake.
7. Compare and evaluate the estimates of metabolism by the relative areal Oz deficit and
hypolimnetic COz accumulation techniques of the lake(s).
8. Answer the questions following Option 2.
OPTION 2. LABORATORY ANALYSES
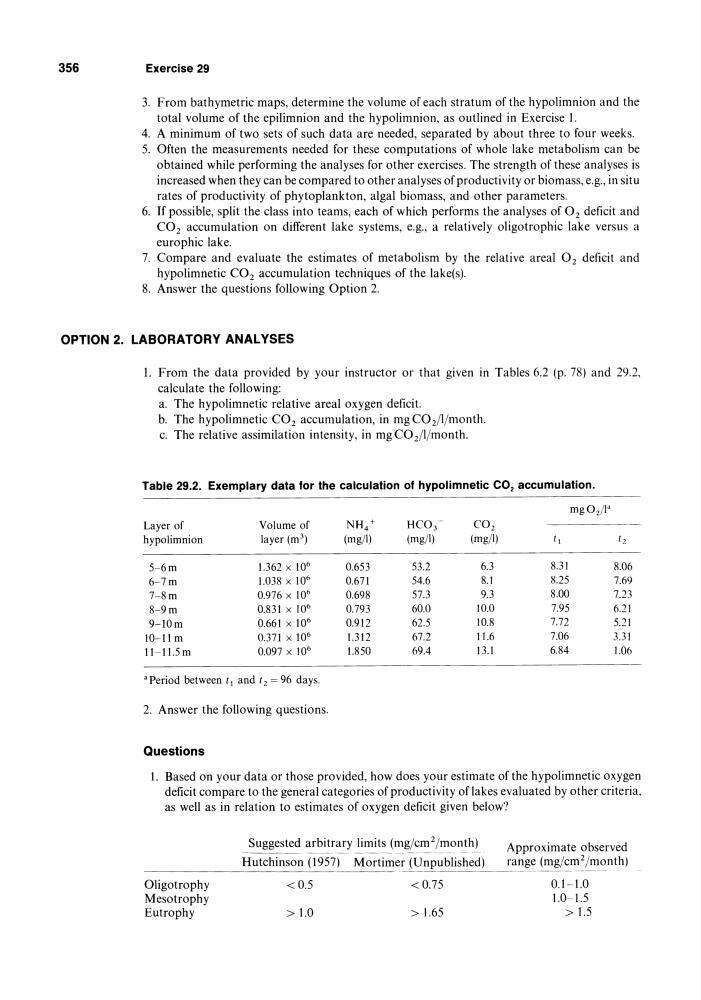
1. From the data provided by your instructor or that given in Tables 6.2 (p. 78) and 29.2,
calculate the following:
a. The hypolimnetic relative areal oxygen deficit.
b. The hypolimnetic COz accumulation, in mgCOz/l/month.
c. The relative assimilation intensity, in mg CO 2 /I/month.
Table 29.2. Exemplary data for the calculation of hypolimnetic CO 2 accumulation.
mg02/1"
Layer of
Volume of
NH4+
HC0 3 -
CO2
hypolimnion
layer (m 3 )
(mg/l)
(mg/l)
(mg/I)
t,
t 2
5-6m
1.362 x 10 6
0.653
53.2
6.3
8.31
8.06
6-7m
1.038 x 10 6
0.671
54.6
8.1
8.25
7.69
7-8m
0.976 x 10 6
0.698
57.3
9.3
8.00
7.23
8-9m
0.831 x 10 6
0.793
60.0
10.0
7.95
6.21
9-lOm
0.661 x 10 6
0.912
62.5
10.8
7.72
5.21
10-11 m
0.371 x 10 6
1.312
67.2
11.6
7.06
3.31
11-11.5m
0.097 x 10 6
1.850
69.4
13.1
6.84
1.06
'Period between t, and t2 =96 days.
2. Answer the following questions.
Questions
1. Based on your data or those provided, how does your estimate of the hypo lim netic oxygen
deficit compare to the general categories of productivity of lakes evaluated by other criteria,
as well as in relation to estimates of oxygen deficit given below?
Oligotrophy
Mesotrophy
Eutrophy
Suggested arbitrary limits (mg/cmz/month)
- - - -
----Hutchinson (1957) Mortimer (Unpublished)
<0.5
<0.75
> 1.0
> 1.65
Approximate observed
range (mg/cm 2 /month)
0.1-1.0
1.0-1.5
> 1.5
Exercise 29
3. From bathymetric maps, determine the volume of each stratum of the hypolimnion and the
total volume of the epilimnion and the hypolimnion, as outlined in Exercise 1.
4. A minimum of two sets of such data are needed, separated by about three to four weeks.
5. Often the measurements needed for these computations of whole lake metabolism can be
obtained while performing the analyses for other exercises. The strength of these analyses is
increased when they can be compared to other analyses of productivity or biomass, e.g., in situ
rates of productivity of phytoplankton, algal biomass, and other parameters.
6. If possible, split the class into teams, each of which performs the analyses of Oz deficit and
COz accumulation on different lake systems, e.g., a relatively oligotrophic lake versus a
europhic lake.
7. Compare and evaluate the estimates of metabolism by the relative areal Oz deficit and
hypolimnetic COz accumulation techniques of the lake(s).
8. Answer the questions following Option 2.
OPTION 2. LABORATORY ANALYSES
1. From the data provided by your instructor or that given in Tables 6.2 (p. 78) and 29.2,
calculate the following:
a. The hypolimnetic relative areal oxygen deficit.
b. The hypolimnetic COz accumulation, in mgCOz/l/month.
c. The relative assimilation intensity, in mg CO 2 /I/month.
Table 29.2. Exemplary data for the calculation of hypolimnetic CO 2 accumulation.
mg02/1"
Layer of
Volume of
NH4+
HC0 3 -
CO2
hypolimnion
layer (m 3 )
(mg/l)
(mg/l)
(mg/I)
t,
t 2
5-6m
1.362 x 10 6
0.653
53.2
6.3
8.31
8.06
6-7m
1.038 x 10 6
0.671
54.6
8.1
8.25
7.69
7-8m
0.976 x 10 6
0.698
57.3
9.3
8.00
7.23
8-9m
0.831 x 10 6
0.793
60.0
10.0
7.95
6.21
9-lOm
0.661 x 10 6
0.912
62.5
10.8
7.72
5.21
10-11 m
0.371 x 10 6
1.312
67.2
11.6
7.06
3.31
11-11.5m
0.097 x 10 6
1.850
69.4
13.1
6.84
1.06
'Period between t, and t2 =96 days.
2. Answer the following questions.
Questions
1. Based on your data or those provided, how does your estimate of the hypo lim netic oxygen
deficit compare to the general categories of productivity of lakes evaluated by other criteria,
as well as in relation to estimates of oxygen deficit given below?
Oligotrophy
Mesotrophy
Eutrophy
Suggested arbitrary limits (mg/cmz/month)
- - - -
----Hutchinson (1957) Mortimer (Unpublished)
<0.5
<0.75
> 1.0
> 1.65
Approximate observed
range (mg/cm 2 /month)
0.1-1.0
1.0-1.5
> 1.5