

Estimates of Whole Lake Metabolism
353
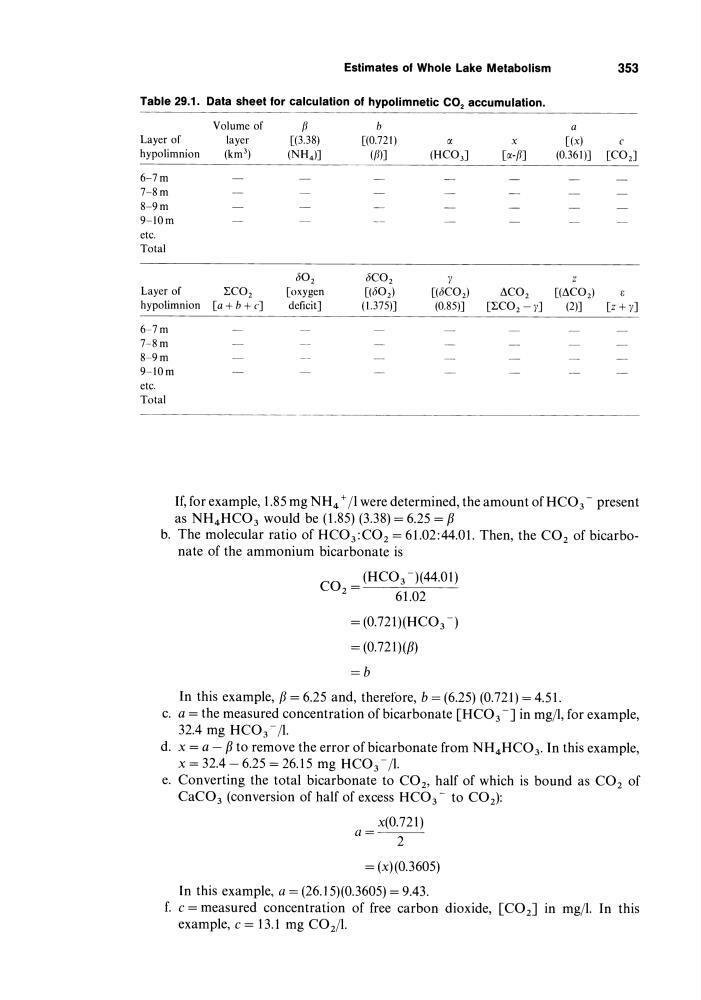
Table 29.1. Data sheet for calculation of hypolimnetic CO 2 accumulation.
Volume of
f3
b
a
Layer of
layer
[(3.38)
[(0.721)
IX
x
[(x)
c
hypolimnion
(km 3 )
(NH4)]
(II)]
(HC03]
[IX-fl]
(0.361)] [CO2]
6-7m
7-8m
8-9m
9-lOm
etc.
Total
D02
DC02
Y
z
Layer of
~C02
[oxygen
[(D0 2 )
[(DC02)
AC0 2
[(AC02)
E
hypolimnion [a+b+c]
deficit]
(1.375)]
(0.85)]
[~C02 - y]
(2)]
[z+y]
6-7m
7-8m
8-9m
9-10m
etc.
Total
If, for example, 1.85 mg NH4 + /1 were determined, the amount of HC0 3 - present
as NH4HC03 would be (1.85) (3.38) = 6.25 = f3
b. The molecular ratio of HC0 3 :C0 2 = 61.02:44.01. Then, the CO 2 of bicarbonate of the ammonium bicarbonate is
CO = (HC03 -)(44.01)
2
61.02
= (0.721)(HC0 3 -)
= (0.721)(f3)
=b
In this example, f3 = 6.25 and, therefore, b = (6.25) (0.721) = 4.51.
c. a = the measured concentration of bicarbonate [HC0 3 -] in mg/1, for example,
32.4 mg HC0 3 - /1.
d. x = a - f3 to remove the error of bicarbonate from NH 4 HC0 3 . In this example,
x = 32.4 - 6.25 = 26.15 mg HC0 3 - /1.
e. Converting the total bicarbonate to CO 2 , half of which is bound as CO 2 of
CaC0 3 (conversion of half of excess HC0 3 - to CO 2 ):
x(0.721)
a=-'-----'2
= (x)(0.3605)
In this example, a = (26.15)(0.3605) = 9.43.
f. c = measured concentration of free carbon dioxide, [C0 2 ] in mg/I. In this
example, c = 13.1 mg CO 2 /1.
353
Table 29.1. Data sheet for calculation of hypolimnetic CO 2 accumulation.
Volume of
f3
b
a
Layer of
layer
[(3.38)
[(0.721)
IX
x
[(x)
c
hypolimnion
(km 3 )
(NH4)]
(II)]
(HC03]
[IX-fl]
(0.361)] [CO2]
6-7m
7-8m
8-9m
9-lOm
etc.
Total
D02
DC02
Y
z
Layer of
~C02
[oxygen
[(D0 2 )
[(DC02)
AC0 2
[(AC02)
E
hypolimnion [a+b+c]
deficit]
(1.375)]
(0.85)]
[~C02 - y]
(2)]
[z+y]
6-7m
7-8m
8-9m
9-10m
etc.
Total
If, for example, 1.85 mg NH4 + /1 were determined, the amount of HC0 3 - present
as NH4HC03 would be (1.85) (3.38) = 6.25 = f3
b. The molecular ratio of HC0 3 :C0 2 = 61.02:44.01. Then, the CO 2 of bicarbonate of the ammonium bicarbonate is
CO = (HC03 -)(44.01)
2
61.02
= (0.721)(HC0 3 -)
= (0.721)(f3)
=b
In this example, f3 = 6.25 and, therefore, b = (6.25) (0.721) = 4.51.
c. a = the measured concentration of bicarbonate [HC0 3 -] in mg/1, for example,
32.4 mg HC0 3 - /1.
d. x = a - f3 to remove the error of bicarbonate from NH 4 HC0 3 . In this example,
x = 32.4 - 6.25 = 26.15 mg HC0 3 - /1.
e. Converting the total bicarbonate to CO 2 , half of which is bound as CO 2 of
CaC0 3 (conversion of half of excess HC0 3 - to CO 2 ):
x(0.721)
a=-'-----'2
= (x)(0.3605)
In this example, a = (26.15)(0.3605) = 9.43.
f. c = measured concentration of free carbon dioxide, [C0 2 ] in mg/I. In this
example, c = 13.1 mg CO 2 /1.