

274
o
Exercise 20
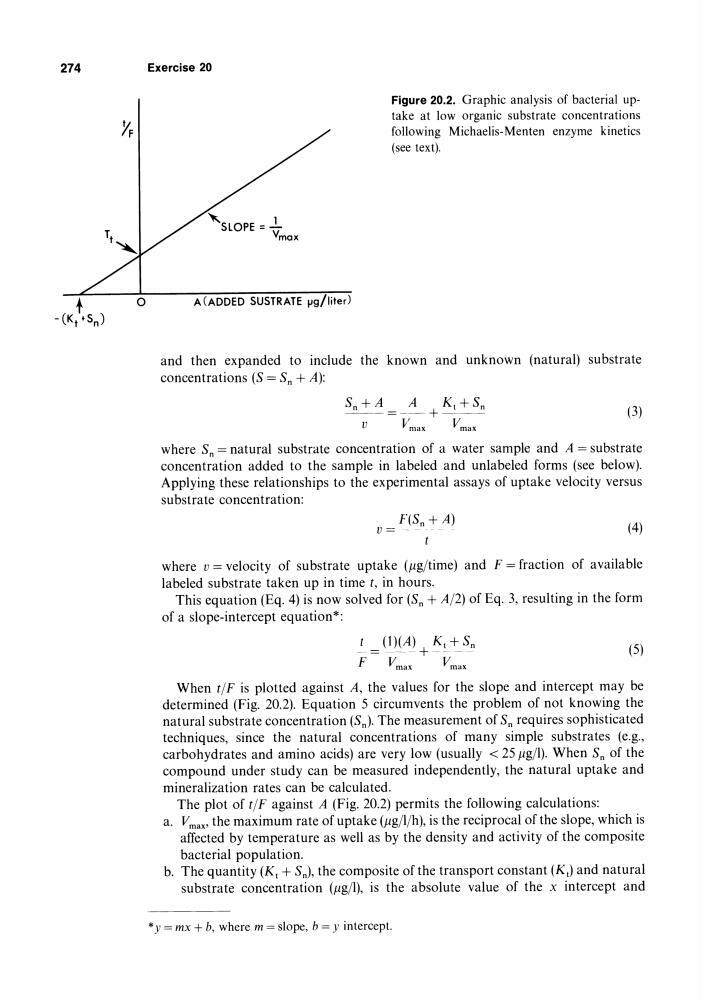
Figure 20.2. Graphic analysis of bacterial uptake at low organic substrate concentrations
following Michaelis-Menten enzyme kinetics
(see text).
A (ADDED SUSTRATE 1l9/liter)
and then expanded to include the known and unknown (natural) substrate
concentrations (S = Sn + A):
Sn + A
A
Kt +Sn
--=---+--v
V max
V max
(3)
where Sn = natural substrate concentration of a water sample and A = substrate
concentration added to the sample in labeled and unlabeled forms (see below).
Applying these relationships to the experimental assays of uptake velocity versus
substrate concentration:
F(Sn + A)
v=-------(4)
t
where v = velocity of substrate uptake (j.tg/time) and F = fraction of available
labeled substrate taken up in time t, in hours.
This equation (Eq. 4) is now solved for (Sn + A12) of Eq. 3, resulting in the form
of a slope-intercept equation*:
t (l)(A) K t + Sn
- = ---- + ----F
V max
V max
(5)
When tlF is plotted against A, the values for the slope and intercept may be
determined (Fig. 20.2). Equation 5 circumvents the problem of not knowing the
natural substrate concentration (Sn). The measurement of Sn requires sophisticated
techniques, since the natural concentrations of many simple substrates (e.g.,
carbohydrates and amino acids) are very low (usually < 25 J.Lgj1). When Sn of the
compound under study can be measured independently, the natural uptake and
mineralization rates can be calculated.
The plot of tlF against A (Fig. 20.2) permits the following calculations:
a. Vmax> the maximum rate of uptake (J.Lg/1/h), is the reciprocal of the slope, which is
affected by temperature as well as by the density and activity of the composite
bacterial population.
b. The quantity (K t + Sn), the composite of the transport constant (K t ) and natural
substrate concentration (J.Lgj1), is the absolute value of the x intercept and
* y = mx + b, where m = slope, b = y intercept.
o
Exercise 20
Figure 20.2. Graphic analysis of bacterial uptake at low organic substrate concentrations
following Michaelis-Menten enzyme kinetics
(see text).
A (ADDED SUSTRATE 1l9/liter)
and then expanded to include the known and unknown (natural) substrate
concentrations (S = Sn + A):
Sn + A
A
Kt +Sn
--=---+--v
V max
V max
(3)
where Sn = natural substrate concentration of a water sample and A = substrate
concentration added to the sample in labeled and unlabeled forms (see below).
Applying these relationships to the experimental assays of uptake velocity versus
substrate concentration:
F(Sn + A)
v=-------(4)
t
where v = velocity of substrate uptake (j.tg/time) and F = fraction of available
labeled substrate taken up in time t, in hours.
This equation (Eq. 4) is now solved for (Sn + A12) of Eq. 3, resulting in the form
of a slope-intercept equation*:
t (l)(A) K t + Sn
- = ---- + ----F
V max
V max
(5)
When tlF is plotted against A, the values for the slope and intercept may be
determined (Fig. 20.2). Equation 5 circumvents the problem of not knowing the
natural substrate concentration (Sn). The measurement of Sn requires sophisticated
techniques, since the natural concentrations of many simple substrates (e.g.,
carbohydrates and amino acids) are very low (usually < 25 J.Lgj1). When Sn of the
compound under study can be measured independently, the natural uptake and
mineralization rates can be calculated.
The plot of tlF against A (Fig. 20.2) permits the following calculations:
a. Vmax> the maximum rate of uptake (J.Lg/1/h), is the reciprocal of the slope, which is
affected by temperature as well as by the density and activity of the composite
bacterial population.
b. The quantity (K t + Sn), the composite of the transport constant (K t ) and natural
substrate concentration (J.Lgj1), is the absolute value of the x intercept and
* y = mx + b, where m = slope, b = y intercept.