

252
OPTION 3
Exercise 18
the best of the series) by actually counting all of the seeds in the can. While counting,
separate the marked and unmarked seeds in order to verify your previous counts of the
marked ones. Discard the marked beans and return all of the seeds to the original container.
8. Use the data from the last sample for a final estimate of the total population with the
Petersen method.
9. Use the data from the series for an estimate by the Schumacher-Eschmeyer method.
10. Calculate the confidence interval for estimates made by both the Petersen and the Schnabel
methods.
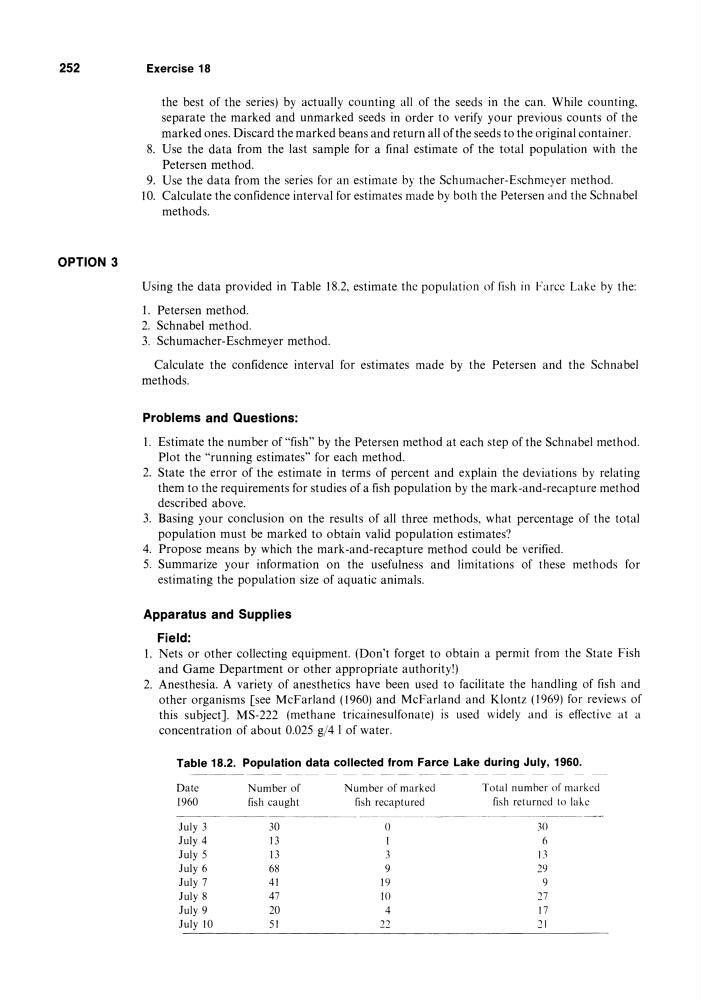
Using the data provided in Table 18.2, estimate the population of fish in Farce Lake by the:
1. Petersen method.
2. Schnabel method.
3. Schumacher-Eschmeyer method.
Calculate the confidence interval for estimates made by the Petersen and the Schnabel
methods.
Problems and Questions:
1. Estimate the number of "fish" by the Petersen method at each step of the Schnabel method.
Plot the "running estimates" for each method.
2. State the error of the estimate in terms of percent and explain the deviations by relating
them to the requirements for studies of a fish population by the mark-and-recapture method
described above.
3. Basing your conclusion on the results of all three methods, what percentage of the total
population must be marked to obtain valid population estimates?
4. Propose means by which the mark-and-recapture method could be verified.
5. Summarize your information on the usefulness and limitations of these methods for
estimating the population size of aquatic animals.
Apparatus and Supplies
Field:
1. Nets or other collecting equipment. (Don't forget to obtain a permit from the State Fish
and Game Department or other appropriate authority!)
2. Anesthesia. A variety of anesthetics have been used to facilitate the handling of fish and
other organisms [see McFarland (1960) and McFarland and Klontz (1969) for reviews of
this subject]. MS-222 (methane tricainesulfonate) is used widely and is effective at a
concentration of about 0.025 g/4 I of water.
Table 18.2. Population data collected from Farce Lake during July, 1960.
-
- - - - - - - - -
-
-
-~
Date
Number of
Number of marked
Total number of marked
1960
fish caught
fish recaptured
fish returned to lake
-
----------July 3
30
0
30
July 4
13
I
6
July 5
13
3
13
July 6
68
<)
19
July 7
41
19
9
July 8
47
10
27
July 9
20
4
17
July 10
51
12
21
OPTION 3
Exercise 18
the best of the series) by actually counting all of the seeds in the can. While counting,
separate the marked and unmarked seeds in order to verify your previous counts of the
marked ones. Discard the marked beans and return all of the seeds to the original container.
8. Use the data from the last sample for a final estimate of the total population with the
Petersen method.
9. Use the data from the series for an estimate by the Schumacher-Eschmeyer method.
10. Calculate the confidence interval for estimates made by both the Petersen and the Schnabel
methods.
Using the data provided in Table 18.2, estimate the population of fish in Farce Lake by the:
1. Petersen method.
2. Schnabel method.
3. Schumacher-Eschmeyer method.
Calculate the confidence interval for estimates made by the Petersen and the Schnabel
methods.
Problems and Questions:
1. Estimate the number of "fish" by the Petersen method at each step of the Schnabel method.
Plot the "running estimates" for each method.
2. State the error of the estimate in terms of percent and explain the deviations by relating
them to the requirements for studies of a fish population by the mark-and-recapture method
described above.
3. Basing your conclusion on the results of all three methods, what percentage of the total
population must be marked to obtain valid population estimates?
4. Propose means by which the mark-and-recapture method could be verified.
5. Summarize your information on the usefulness and limitations of these methods for
estimating the population size of aquatic animals.
Apparatus and Supplies
Field:
1. Nets or other collecting equipment. (Don't forget to obtain a permit from the State Fish
and Game Department or other appropriate authority!)
2. Anesthesia. A variety of anesthetics have been used to facilitate the handling of fish and
other organisms [see McFarland (1960) and McFarland and Klontz (1969) for reviews of
this subject]. MS-222 (methane tricainesulfonate) is used widely and is effective at a
concentration of about 0.025 g/4 I of water.
Table 18.2. Population data collected from Farce Lake during July, 1960.
-
- - - - - - - - -
-
-
-~
Date
Number of
Number of marked
Total number of marked
1960
fish caught
fish recaptured
fish returned to lake
-
----------July 3
30
0
30
July 4
13
I
6
July 5
13
3
13
July 6
68
<)
19
July 7
41
19
9
July 8
47
10
27
July 9
20
4
17
July 10
51
12
21