

The Inorganic Carbon Complex
127
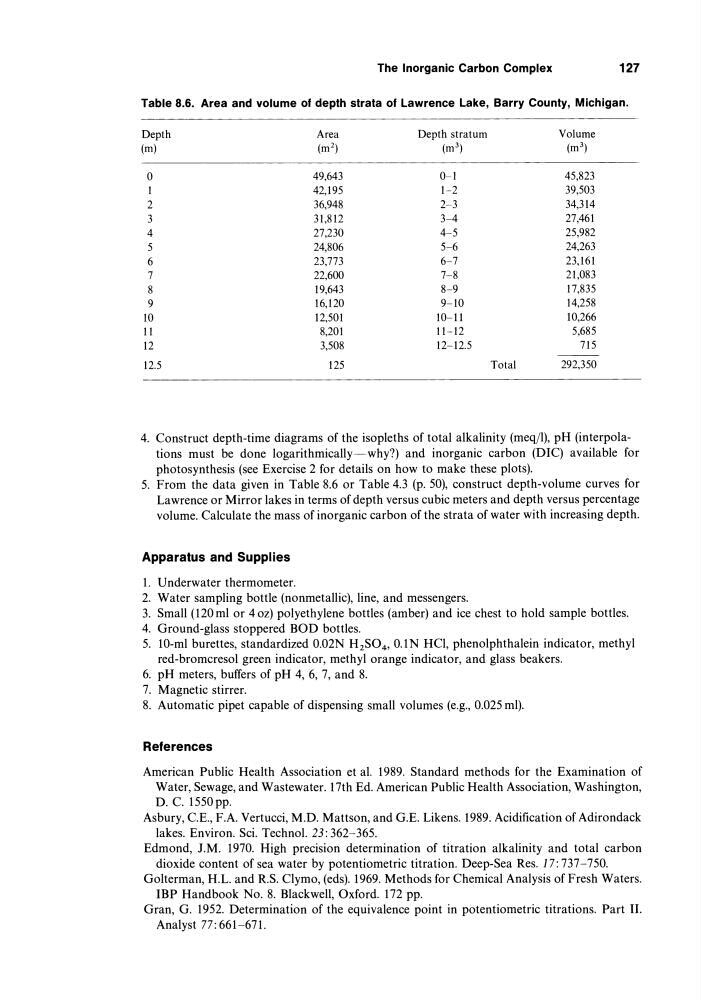
Table 8.6. Area and volume of depth strata of Lawrence Lake, Barry County, Michigan.
Depth
Area
Depth stratum
Volume
(m)
(m 2 )
(m 3 )
(m 3 )
0
49,643
0-1
45,823
1
42,195
1-2
39,503
2
36,948
2-3
34,314
3
31,812
3-4
27,461
4
27,230
4-5
25,982
5
24,806
5-6
24,263
6
23,773
6-7
23,161
7
22,600
7-8
21,083
8
19,643
8-9
17,835
9
16,120
9-10
14,258
10
12,501
10-11
10,266
11
8,201
11-12
5,685
12
3,508
12-12.5
715
12.5
125
Total
292,350
4. Construct depth-time diagrams of the isopleths of total alkalinity (meq/l), pH (interpolations must be done logarithmically-why?) and inorganic carbon (DIC) available for
photosynthesis (see Exercise 2 for details on how to make these plots).
5. From the data given in Table 8.6 or Table 4.3 (p. 50), construct depth-volume curves for
Lawrence or Mirror lakes in terms of depth versus cubic meters and depth versus percentage
volume. Calculate the mass of inorganic carbon of the strata of water with increasing depth.
Apparatus and Supplies
1. Underwater thermometer.
2. Water sampling bottle (nonmetallic), line, and messengers.
3. Small (120 ml or 40z) polyethylene bottles (amber) and ice chest to hold sample bottles.
4. Ground-glass stoppered BOD bottles.
5. lO-ml burettes, standardized 0.02N H 2S04 , O.IN HCl, phenolphthalein indicator, methyl
red-bromcresol green indicator, methyl orange indicator, and glass beakers.
6. pH meters, buffers of pH 4, 6, 7, and 8.
7. Magnetic stirrer.
8. Automatic pipet capable of dispensing small volumes (e.g., 0.025 ml).
References
American Public Health Association et a!. 1989. Standard methods for the Examination of
Water, Sewage, and Wastewater. 17th Ed. American Public Health Association, Washington,
D. C. 1550pp.
Asbury, C.E., F.A. Vertucci, M.D. Mattson, and G.E. Likens. 1989. Acidification of Adirondack
lakes. Environ. Sci. Techno!. 23: 362-365.
Edmond, I.M. 1970. High precision determination of titration alkalinity and total carbon
dioxide content of sea water by potentiometric titration. Deep-Sea Res. 17: 737-750.
Golterman, H.L. and R.S. Clymo, (eds). 1969. Methods for Chemical Analysis of Fresh Waters.
IBP Handbook No.8. Blackwell, Oxford. 172 pp.
Gran, G. 1952. Determination of the equivalence point in potentiometric titrations. Part II.
Analyst 77: 661-671.
127
Table 8.6. Area and volume of depth strata of Lawrence Lake, Barry County, Michigan.
Depth
Area
Depth stratum
Volume
(m)
(m 2 )
(m 3 )
(m 3 )
0
49,643
0-1
45,823
1
42,195
1-2
39,503
2
36,948
2-3
34,314
3
31,812
3-4
27,461
4
27,230
4-5
25,982
5
24,806
5-6
24,263
6
23,773
6-7
23,161
7
22,600
7-8
21,083
8
19,643
8-9
17,835
9
16,120
9-10
14,258
10
12,501
10-11
10,266
11
8,201
11-12
5,685
12
3,508
12-12.5
715
12.5
125
Total
292,350
4. Construct depth-time diagrams of the isopleths of total alkalinity (meq/l), pH (interpolations must be done logarithmically-why?) and inorganic carbon (DIC) available for
photosynthesis (see Exercise 2 for details on how to make these plots).
5. From the data given in Table 8.6 or Table 4.3 (p. 50), construct depth-volume curves for
Lawrence or Mirror lakes in terms of depth versus cubic meters and depth versus percentage
volume. Calculate the mass of inorganic carbon of the strata of water with increasing depth.
Apparatus and Supplies
1. Underwater thermometer.
2. Water sampling bottle (nonmetallic), line, and messengers.
3. Small (120 ml or 40z) polyethylene bottles (amber) and ice chest to hold sample bottles.
4. Ground-glass stoppered BOD bottles.
5. lO-ml burettes, standardized 0.02N H 2S04 , O.IN HCl, phenolphthalein indicator, methyl
red-bromcresol green indicator, methyl orange indicator, and glass beakers.
6. pH meters, buffers of pH 4, 6, 7, and 8.
7. Magnetic stirrer.
8. Automatic pipet capable of dispensing small volumes (e.g., 0.025 ml).
References
American Public Health Association et a!. 1989. Standard methods for the Examination of
Water, Sewage, and Wastewater. 17th Ed. American Public Health Association, Washington,
D. C. 1550pp.
Asbury, C.E., F.A. Vertucci, M.D. Mattson, and G.E. Likens. 1989. Acidification of Adirondack
lakes. Environ. Sci. Techno!. 23: 362-365.
Edmond, I.M. 1970. High precision determination of titration alkalinity and total carbon
dioxide content of sea water by potentiometric titration. Deep-Sea Res. 17: 737-750.
Golterman, H.L. and R.S. Clymo, (eds). 1969. Methods for Chemical Analysis of Fresh Waters.
IBP Handbook No.8. Blackwell, Oxford. 172 pp.
Gran, G. 1952. Determination of the equivalence point in potentiometric titrations. Part II.
Analyst 77: 661-671.