

114
Exercise 8
Table 8.1. Example of titration data for 50-ml solution of
sodium bicarbonate. a
Acid Added
Fl
(ml)
pH
(Eq.)
0
8.169
3.385 (E-IO)
0.D25
6.901
6.279 (E-9)
0.050
6.478
1.665 (E-8)
0.075
6.129
3.720 (E-8)
0.100
5.718
9.584 (E-8)
0.125
4.961
5.486 (E-7)
0.150
4.281
2.626 (E-6)
0.175
3.995
5.078 (E-6)
0.200
3.822
7.569 (E-6)
0.225
3.698
1.007 (E-5)
0.250
3.601
1.258 (E-5)
0.275
3.523
1.510 (E-5)
0.300
3.456
1.761 (E-5)
"The pH and Gran function are shown for increments of 0.025 ml
of O.1N strong and additions.
The most accurate procedure is the Gran titration (Gran, 1952), in which known
increments of standard acid are used to titrate well beyond the equivalence point, to
where proton accumulation is proportional directly to the titrant added, and then
extrapolate back to the titrant volume of the equivalence point (Edmond, 1970).
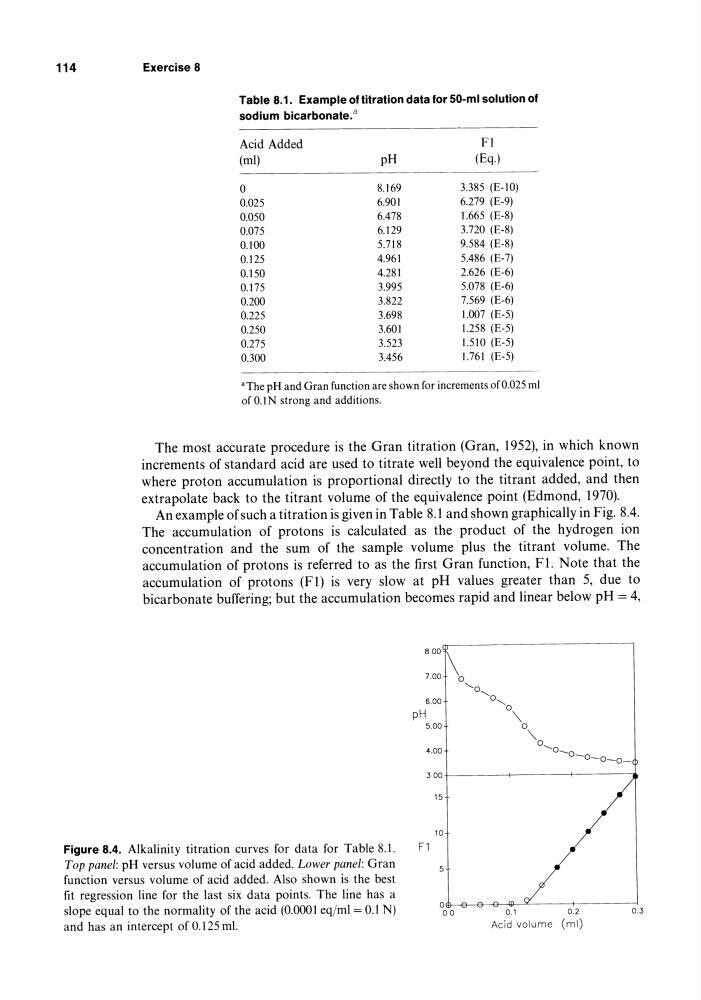
An example of such a titration is given in Table 8.1 and shown graphically in Fig. 8.4.
The accumulation of protons is calculated as the product of the hydrogen ion
concentration and the sum of the sample volume plus the titrant volume. The
accumulation of protons is referred to as the first Gran function, Fl. Note that the
accumulation of protons (Fl) is very slow at pH values greater than 5, due to
bicarbonate buffering; but the accumulation becomes rapid and linear below pH = 4,
8 00
7.00
6.00
pH
5.00
4.00
300~------+-------+-------~
15
10
Figure 8.4. Alkalinity titration curves for data for Table 8.1.
Top panel: pH versus volume of acid added. Lower panel: Gran
function versus volume of acid added. Also shown is the best
fit regression line for the last six data points. The line has a
slope equal to the normality of the acid (0.0001 eq/ml = 0.1 N)
and has an intercept of 0.125 m!.
F1
5
0.1
0.2
0.3
Acid volume em I)
Exercise 8
Table 8.1. Example of titration data for 50-ml solution of
sodium bicarbonate. a
Acid Added
Fl
(ml)
pH
(Eq.)
0
8.169
3.385 (E-IO)
0.D25
6.901
6.279 (E-9)
0.050
6.478
1.665 (E-8)
0.075
6.129
3.720 (E-8)
0.100
5.718
9.584 (E-8)
0.125
4.961
5.486 (E-7)
0.150
4.281
2.626 (E-6)
0.175
3.995
5.078 (E-6)
0.200
3.822
7.569 (E-6)
0.225
3.698
1.007 (E-5)
0.250
3.601
1.258 (E-5)
0.275
3.523
1.510 (E-5)
0.300
3.456
1.761 (E-5)
"The pH and Gran function are shown for increments of 0.025 ml
of O.1N strong and additions.
The most accurate procedure is the Gran titration (Gran, 1952), in which known
increments of standard acid are used to titrate well beyond the equivalence point, to
where proton accumulation is proportional directly to the titrant added, and then
extrapolate back to the titrant volume of the equivalence point (Edmond, 1970).
An example of such a titration is given in Table 8.1 and shown graphically in Fig. 8.4.
The accumulation of protons is calculated as the product of the hydrogen ion
concentration and the sum of the sample volume plus the titrant volume. The
accumulation of protons is referred to as the first Gran function, Fl. Note that the
accumulation of protons (Fl) is very slow at pH values greater than 5, due to
bicarbonate buffering; but the accumulation becomes rapid and linear below pH = 4,
8 00
7.00
6.00
pH
5.00
4.00
300~------+-------+-------~
15
10
Figure 8.4. Alkalinity titration curves for data for Table 8.1.
Top panel: pH versus volume of acid added. Lower panel: Gran
function versus volume of acid added. Also shown is the best
fit regression line for the last six data points. The line has a
slope equal to the normality of the acid (0.0001 eq/ml = 0.1 N)
and has an intercept of 0.125 m!.
F1
5
0.1
0.2
0.3
Acid volume em I)